Curated by
ACT
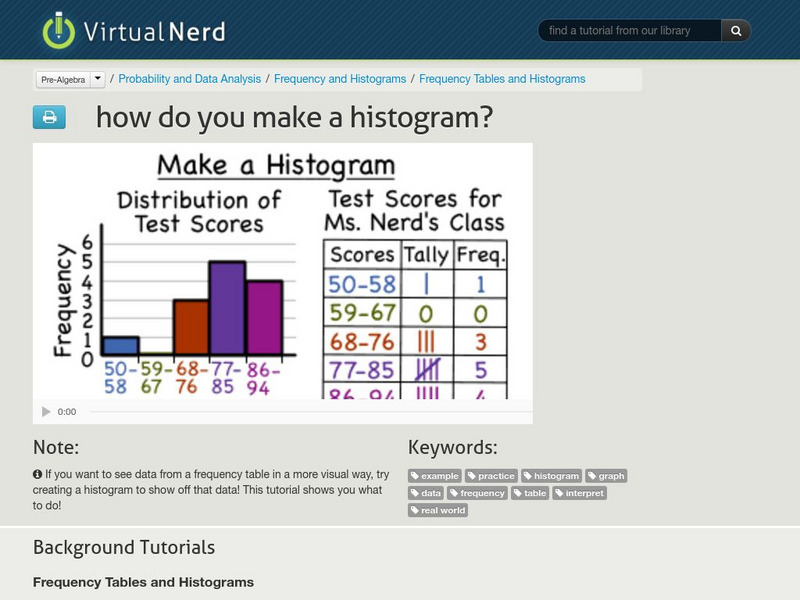
A histogram is a great way to show off visual data. This tutorial illustrates how to make one. [5:34]
3 Views
0 Downloads
Additional Tags
Classroom Considerations
- Knovation Readability Score: 3 (1 low difficulty, 5 high difficulty)
- The intended use for this resource is Instructional
