New York State Education Department
English Language Arts Examination: June 2018
Is graffiti art? Writers explore that question as part of a source-based argument within a set of questions from the NY Regents examination. The assessment from June 2018, part of a larger set of standardized tests, consists of three...
Curated OER
Identifying Economic Systems
Young historians practice identifying evidence to categorize a particular country's economic system as either a mixed, centrally planned, traditional, or free economic system in this two-part lesson.
Curated OER
Discovering Pi
Define terminology related to a circle. Practice accuracy in measuring and then create a spreadsheet based on data collected from solving for parts of a circle. Groups can have fun analyzing their data as it relates to Pi.
University of North Carolina
Figures and Charts
Sometimes words aren't the best way to get information across to the reader. The eighth handout in the 24-part Writing the Paper series describes different type of figures and charts to display complex information in a paper....
New York State Education Department
English Language Arts Examination: August 2015
Assessing a variety of skills using numerous item types is a great way to collect data for formative and summative use. Using a challenging exam, scholars prove their comprehension and reading skills through multiple choice, task, and...
Curated OER
It Has Been Rubbish For Years
Students are presented with the problems of percentages and focus upon numbers in contrast to 100. They calculate problems with money and are engaged with the use of games as a teaching tool. Students also interpret data as presented in...
National Security Agency
Going Green with Graphs
In this unit designed for second graders, youngsters are introduced to conducting surveys and creating tally charts based on the data they gather. Students then construct bar graphs, and observe the relationships between the two...
Howard Hughes Medical Institute
DNA Profiling Activity
Everyone loves a good mystery ... can your class actually solve one? Partnered pupils take on the role of forensic investigators during a three-part activity focusing on DNA evidence processing. Learners discover the methods used to...
Curated OER
Comparing Animal and Plant Cell Structure
Students work as a team to use the ProScope Digital USB Microscope and a computer to collect microscopic images from a variety of organisms. When they compare these specimens, they are able to determine how they are alike and different...
New South Wales Department of Education
Plant Features
Pine needles are actually modified leaves. In the 16th installment of 20, young scientists explore plants. Through an analysis of leaves — shape, veins, and edges — pupils see how to classify plants based on structural features.
Santa Monica College
The Density of Liquids and Solids
There are underwater rivers that flow on the ocean floor thanks to a difference in density. Scholars learn about the density in both liquids and solids in the second lesson of an 11-part series. They then determine the density of water,...
Curated OER
Exploring Renewable Energy Through Graphs and Statistics
Ninth graders identify different sources of renewable and nonrenewable energy. In this math lesson, learners calculate their own carbon footprint based on the carbon dioxide they create daily. They use statistics to analyze data on power...
Inside Mathematics
Quadratic (2009)
Functions require an input in order to get an output, which explains why the answer always has at least two parts. After only three multi-part questions, the teacher can analyze pupils' strengths and weaknesses when it comes to...
Curated OER
A Research Project and Article For the Natural Inquirer
Get your class to use the scientific process to solve a scientific problem. They utilize the Natural Inquirer magazine to identify a research question which they write an introduction to and collect data to answer. They use graphs,...
Curated OER
Ant Bodies
Students name the three parts that comprise an insect body. For this ant lesson, students make connections regarding the curiosity of insects as it touches upon the students' personal perspectives. Students then observe ants in...
Curated OER
Global Warming WebQuest-Climate Scientist
In this climate science worksheet, students answer five multi-part questions on the responsibilities of a climate scientist. Students may gain this knowledge through a WebQuest.
Curated OER
Phineas Gage: Personal Phrenology Chart During Reading Activity
Phrenology, the belief that parts of your brain control certain aspects of your personality, is described in Phineas Gage: A Gruesome but True Story About Brain Science. While we now know much more about the brain, learners use this...
Novelinks
The Good Earth: Vocabulary Bingo Strategy
Endeavor. Qualm. Stolid. Fortitude. Filial. Bingo! As part of their study of Pearl Buck's The Good Earth, class members engage in a vocabulary bingo game.
EngageNY
Tax, Commissions, Fees, and Other Real-World Percent Problems
Pupils work several real-world problems that use percents in the 11th portion of a 20-part series. The problems contain percents involved with taxes, commissions, discounts, tips, fees, and interest. Scholars use the equations formed for...
Smithsonian Institution
Trait Tracker
Help mice beat the odds with an exciting activity about traits. Biologists discover the role of diet and other factors on animal traits by participating in a simulation activity. Teams collect and evaluate data to understand how certain...
Curated OER
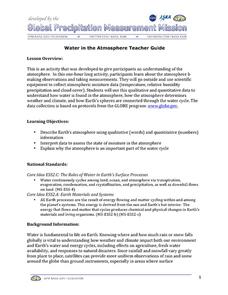
Water in the Atmosphere
A slide show serves as the backdrop for a lesson on the moisture in Earth's atmosphere. Through it, mini meteorologists learn about the attributes of the atmosphere and actually use data-collecting weather tools to make observations and...
Curated OER
Poetry: Walking With My Iguana
Bring a little excitement to your next poetry analysis lesson. Using the highly energetic poem "Walking With My Iguana," learners consider poem structure and rhyme. They listen to the poem, discuss the rhythm and tone with their...
University of Colorado
Distance = Rate x Time
Every year, the moon moves 3.8 cm farther from Earth. In the 11th part of 22, classes use the distance formula. They determine the distance to the moon based upon given data and then graph Galileo spacecraft data to determine its movement.
Smithsonian Institution
Weather Widget
What's so difficult about predicting the weather? Scholars work collaboratively to build a device that models how meteorologists use computers to forecast weather. Team members collect and interpret data while working together to...


