Curated OER
What is the purpose of Karyotyping?
Students explain how karyotyping is used to diagnose specific genetic disorders. They use karyotypes to make observations and analyze chromosomal errors. This activity can be completed online or without computer access.
Curated OER
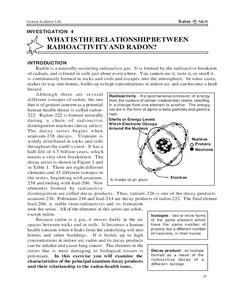
What is the Relationship Between Radioactivity and Radon?
In this radon and radioactivity worksheet, students analyze the data of the isotopes of elements that occur in the decay series of uranium-238. Students answer 6 questions about the isotopes, their half-lives, their potential threat and...
Curated OER
What is Energy?
In this energy worksheet, 7th graders study the varying types of energy. Students read the 7 types of energy listed and complete the chart giving an example for each.
Curated OER
What is the Solar System?
In this solar system worksheet, students will use a Venn Diagram to write about the characteristics that are unique to a moon and to a planet and then the characteristics that are the same for both a moon and planet.
Curated OER
What is a Plant?
In this plant characteristics instructional activity, students will read a paragraph about plants and then use the information found in that paragraph to complete 3 short answer questions about plant adaptations.
University of Texas
What Are Calories?
What are calories, and how do calorie needs differ from person to person? Here is a worksheet that briefly explains how calories measure the energy supplied by food, as well as suggests the amount of food an individual should eat per day.
Lesson Plans
Macromolecule Worksheet
Biology scholars are asked to define and explain, to complete a chart, and to fill in the blanks for seventeen macromolecule questions. Easy for pupils to read and comprehensive in content, this is a resource that you will want to use....
Curated OER
Branches of Earth Science
Connect earth science to science occupations and real-life events with this worksheet and activity. After listing the 4 branches of earth science, learners spend some time brainstorming two activities each type of earth scientist might...
University of Colorado
The Moons of Jupiter
Can you name the three planets with rings in our solar system? Everyone knows Saturn, many know Uranus, but most people are surprised to learn that Jupiter also has a ring. The third in a series of six teaches pupils what is around...
Curated OER
Molarity Worksheet
Chemistry pros calculate mass, volume, concentration, or molarity of five different solutions. This tidy worksheet makes an appropriate homework assignment when studying molarity.
Teach Engineering
What a Drag!
Stop and drop what is in your hand! Pupils investigate how form effects drag in the 12th part of a 22-part unit on aviation. Groups create equally weighted objects and determine which one falls the fastest by collecting data.
Class Antics
Leap Year
What is a Leap Year and why do we have it? Find out with this Leap Day/Leap Year response to reading learning exercise in which scholars read a short passage and use their new-found knowledge to answer five questions with short...
Mr. E. Science
Climate and Climate Change
What factors make up climate? How does longitude and latitude affect climate? What is causing Earth's climate to change? These questions are the topic of a presentation that explains characteristics of climate and climate change.
Shelby County Schools
How Ecosystems Work
How does one organism get its energy? What is the main source of energy in an ecosystem? How does the flow of energy affect different types of ecosystems? Answer these questions with a fill-in-the-blank worksheet.
BioEd Online
Bone Structure: Hollow vs. Solid
What is meant by the phrase "form follows function?" Allow your budding biologists to discover first-hand through two activities. In the first, groups work together to discover whether a solid cylinder or an empty cylinder can support...
Chicago Botanic Garden
Weather or Not
What is the difference between weather and climate? This is the focus question of a lesson plan that takes a deeper look at how weather data helps determine climate in a region. Using weather and climate cards, students decide...
Curated OER
Solar Car Series: during What Part of the Day Can the Most Sun Power Be Collected?
In preparation for solar car races, middle schoolers attempt to discover what time of day the most solar energy can be collected. Begin by demonstrating the use of a voltmeter for measuring solar cell output. Take them outdoors to take...
Polar Trec
Is There Salt in a Glacier?
What can conductivity tell us about a glacier? Groups analyze glacial melt to determine salt content through an analysis of the pH and conductivity measurements of two samples. Groups then determine the source of the salts.
Project WET Foundation
Healthy Water Healthy People
People and water have something in common. They both need to be healthy. Explore with an engaging interactive what it means to have a healthy body and why having healthy water is also important.
PBS
The Chrysalis or Pupa
What is one of the most exciting parts of a butterfly's life cycle? When it emerges from its pupa and dries its wings! This is a great activity little ones will love. They discuss what happens during the pupal stage of the butterfly life...
Aquarium of the Pacific
Think Like a Scientist
Scholars watch a video and meet a scientist who is studying sharks as she explains her observations about the sharks and provides her hypothesis to explain their behavior. Learners then act like a scientist as they watch an aquarium...
Curated OER
What is Hazardous at Your House?
In this hazards in the home worksheet, students unscramble hint to discover words of hazardous household items, 6 total. Answers included on page 2.
Curated OER
What is in the Water?
In this mixtures worksheet, learners read about mixture and what determines if a solute dissolves in a solvent. They answer three questions about solutions and determine from a list of compounds which are soluble in water.
Curated OER
What is an Average?
In this averages worksheet, students practice finding the averages of numbers. They use a chart with data to find the average number of wildfires in four states between 1993 and 1996.


