EngageNY
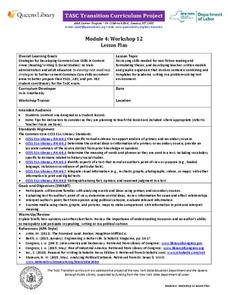
TASC Transition Curriculum: Workshop 12
How can opinions slant facts? Workshop participants learn how to examine primary and secondary sources and identify the author's point of view. They also examine how visual art impacts the meaning and rhetoric of sources. Full of...
Curated OER
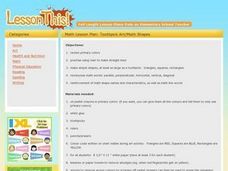
Toothpick Art
Learners review primary colors and practice making straight lines. In this visual arts instructional activity, students paint simple shapes as large as a toothpick, using specific primary colors. During the construction of the shapes...
Oklahoma State University
A Hundred Bales of Hay
This instructional activity combines math, visual arts, and language arts activities that all focus on the making, and baling of hay. The activities can be adjusted to address different age ranges. Most of the activities focus on gaining...
Curated OER
Mighty Oaks from Little Acorns
What does it mean to grow? To germinate? For the plan detailed here, class members investigate the growth process of an oak tree while focusing on the beginning stages of planting and germination. They plant seeds and record observations...
Curated OER
Beef or Dairy?
Guernsey, Jersey, Holstein. Brangus, Charoloais, Herford. Here’s a truly cross-curricular resource that combines language arts, science, math, and visual arts activities as class members learn to distinguish between beef and dairy...
Curated OER
An Apple a Day
Students sort and compare apples before making apple prints. In this apple lesson plan, students use a painting to inspire art prints made with apple halves. Students compare and sort apples.
Curated OER
Mondrian, Math, and Amazing Colors
Students study geometric shapes, lines, and the primary colors as they create Mondrian-like art prints.
Curated OER
Symmetry: Theory, Reality and Art!
Students explore the concept of geometric symmetry. In this geometric symmetry lesson, students walk around their school and take pictures of objects that demonstrate symmetry. Students use Microsoft Paint to draw the lines of symmetry...
Curated OER
Measurement & Cooking - Rice Krispie Treats
Pupils practice their measuring and cooking skills with a box of Rice Krispies. In this culinary lesson plan, students utilize a box of Rice Krispies, butter, marshmallows and utensils to cook a batch of Rice Krispie Treats. Pupils...
Curated OER
Biomimicry, Nature: Architecture of the Future
Students explore the relationship between nature and architecture. In this cross curriculum history, culture, and architecture lesson, students observe and discuss structures visible in nature. Students view websites in which Native...
Curated OER
Create Koi Nobori: Carp Kites
Students study the Japanese art of Koi Nabori or carp kites. They create their own carp kites with repeating patterns.
Curated OER
Education for Global Peace
Fifth graders construct data graphs based upon sets of data. In this graphing lesson, 5th graders read the text If the World Were a Village and discuss how types of graphs accurately represent a large population. Students construct their...
Curated OER
Parts of a Whole
Fourth graders explore fractions through the analysis of various paintings. They view and discuss paintings by Picasso and Seurat, discuss the fractional examples in the paintings, and create a bar graph.
Curated OER
What's Your Expression
First graders explore facial expressions in a mirror and create drawings of people with a facial expression of their choice. They graph the facial expressions drawn.
Curated OER
Tallying Animals
Second graders draw a picture of a pond scene which includes various animals. They exchange pictures and tally the number of animals drawn. Then they record the number on a chart and write a story about their pictures.
Curated OER
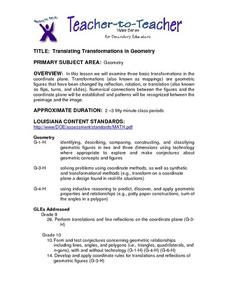
Translating Transformations in Geometry
Students create an image using given coordinates and evaluate how the coordinates change when a slide or rotation takes place.
Curated OER
You mean college costs that much?
Seventh graders collect, organize, and analyze data as they research colleges on the Internet. They graph their collected data on a line graph and use a spreadsheet on Microsoft Excel in order to organize the data.


