Teach Engineering
Using Map Scales to Figure Distances and Areas
The asteroid is getting closer and the question is whether the state of Alabraska is large enough for the shelter calculated in the previous activity. Teams determine the scale of their project and then use the scale on the map to...
Artisan Global
QuakeFeed Earthquake Map, Alerts and News
Amateur seismologists explore Earth's earthquakes in real time using a variety of map styles and parameter selections.
Curated OER
The History of Life on Earth
Using meters as years, your class works together to map out the geologic time scale on a football field. Plenty of background information is included in this lesson plan as well as several resource links and a student worksheet. Your...
Curated OER
Scaling it Down: Caves Have Maps, Too
Measurement and map skills are the focus of this lesson, where students crawl through a "cave" made out of boxes, desks and chairs, observing the dimensions. Your young geographers measure various aspects of the cave and practice...
Space Awareness
Let's Map the Earth
Before maps went mobile, people actually had to learn how to read maps. Pupils look at map elements in order to understand how to read them and locate specific locations. Finally, young cartographers discover how to make aerial maps.
Curated OER
Mapping
Introduce middle or high schoolers to topographic maps with this PowerPoint. After a review of longitude and latitude, display and describe contour lines and intervals. Also explain map scale. This is a useful presentation for a social...
CK-12 Foundation
Topographic and Geologic Maps: Topographic Maps
Maps are great for helping you get where you're going, but what does that place actually look like? Geology scholars compare and contrast the features of topographical and geologic maps using an interactive lesson. The resource describes...
Curated OER
Scale/Ratio
Investigate the use of ratios in scale drawings. Learners scale objects up or down using ratios then find the actual size of something using ratios. They apply their knowledge of ratios as they make their own telescopes in science...
Curated OER
Mapping the Aegean Seafloor
Earth science learners create a two-dimensional topographic map of the floor of the Aegean Sea. They use it to then create a three-dimensional model of the ocean floor features. This comprehensive resource delivers strong background...
National Wildlife Federation
Quantifying Land Changes Over Time Using Landsat
"Humans have become a geologic agent comparable to erosion and [volcanic] eruptions ..." Paul J. Crutzen, a Nobel Prize-winning atmospheric chemist. Using Landsat imagery, scholars create a grid showing land use type, such as urban,...
Curated OER
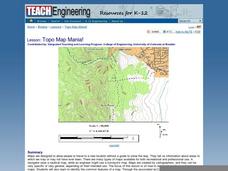
Topo Map Mania!
Seventh graders describe the major features of maps and compasses. They read a topographical map. They take a bearing using a compass. They practice using scales on a map.
Curated OER
Mapping the Bone Field: An Area and Scale Exercise
Here is an excellent cross-curricular lesson. Learners relate multiplication to area by making a grid on graph paper, and then creating the same grid in real space outside in the school yard.
Curated OER
Exploring Biomes Lesson 4: Mapping Arizona
Once junior ecologists are familiar with Earth's major biomes, they hone in on Arizona's biomes. Using a website about Arizona's natural resources, learners will identify biotic communities. Beautiful maps and worksheets are provided for...
Curated OER
Exploring Arizona's Biotic Communities Lesson 1: Mapping Biotic Communities
As part of a unit on Arizona's biotic communities, young ecology learners create a map. They describe how humans and animals adapt in their habitat. They take notes and create graphic organizers from articles they read. Beautiful maps,...
Cornell University
Too Much of a Good Thing?
Continuing their study of beneficial insects, young entomologists discover where in the world some of these bugs are. By labeling, coloring, and using the scale on a map, pupils explore the territories and arrival of the Asian lady...
Curated OER
Having a Hot Time on Mars!
In this cosmic radiation on Mars learning exercise, students study a radiation map of Mars taken by the MARIE instrument on the Odyssey spacecraft. Students answer 4 questions using the radiation map and they answer questions about the...
NASA
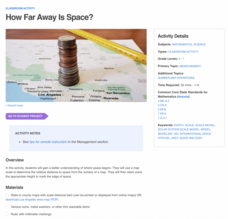
How Far Away Is Space?
Space is about 60 miles from the surface of Earth. Pupils make calculations to model that distance by stacking coins the appropriate height using scale. They then explore the distance to objects in space such as satellites and the space...
Curated OER
Tracking Satellites Using Latitude and Longitude
Students, viewing an Internet site, plot the path of several satellites using latitude and longitude over the course of an hour. They learn the four basic types of satellites and their purpose.
Curated OER
Understanding Topographic Maps
Underclassmen create a cone-shaped landform and then draw a contour map for it. Then they examine a quadrangle (which was easily located with an online search), and relate it to what they experienced. The accompanying worksheet is...
Curated OER
Map Scale
Third and fourth graders are introduced to the concept of map scale. Using an illustration, they discuss if it shows the actual size of the object and why scale is used to represent areas. They use some items in the illustration to...
Curated OER
Designing a Hiking Trail
Put your students' map skills to the test with this engaging cross-curricular project. Given the task of developing new hiking trails for their local community, young cartographers must map out beginner and intermediate...
Science Matters
Finding the Epicenter
The epicenter is the point on the ground above the initial point of rupture. The 10th lesson in a series of 20 encourages scholars to learn to triangulate the epicenter of an earthquake based on the arrival times of p waves and s...
Curated OER
MAPS AND TOPOGRAPHY
Students analyze the details of a topographic map and create one of their own by utilyzing a map of elevations.
Curated OER
Maps Reinforcement
In this map instructional activity, students complete 6 multiple choice questions and 5 short answer questions about 3 different map figures.

