Howard Hughes Medical Institute
Color Variation Over Time in Rock Pocket Mouse Populations
While many mutations are neutral, those that appear advantageous increase in frequency in a population. Scholars use illustrations to make predictions about populations of mice. They follow it up with a video to confirm or refute their...
Shmoop
ELA.CCSS.ELA-Literacy.RI.11-12.7
Comparing information found in images, charts, and graphs with that found in written text can be a challenge for even senior high scholars. Provide learners with an opportunity to practice this skill with an exercise that asks them to...
US Department of Commerce
Featured Activity: Population Change Over Time
Keep track of a state's population. After a brief discussion on how population data is used for funding, individuals look at population changes over time. Pupils find the population of two states using three different censuses. They then...
Curated OER
Convergence with The Cay: Exploring Geographic Concepts Wrapped in a Story
Here's an awesome unit that uses The Cay as the anchor text. The 16-page packet is loaded with teaching ideas, activities, and suggested adjustments.
Regents Prep
Activity to Show Sample Population and Bias
There is bias in many aspects of our lives, and math is no exception! Learners explore provided data to understand the meaning of biased and random samples. The resource includes various data sets from the same population, and...
Howard Hughes Medical Institute
Patterns in the Distribution of Lactase Persistence
We all drink milk as babies, so why can't we all drink it as adults? Examine the trend in lactase production on the world-wide scale as science scholars analyze and interpret data. Groups create pie charts from the data, place them on a...
Sharp School
Geography Project
This very simple geography project can lead to a lot of useful referential information that can be displayed in your classroom! Learners construct a poster-size map of a country, identifying major demographic points and including pie/bar...
Space Race
Sensory Detectives
Test your learners' sensory awareness with three hands-on activities that ask pupils to use their other senses to identify and describe everyday objects hidden from sight.
Curated OER
Activity: An Experiment with Dice
Roll the dice with this activity and teach young mathematicians about probability. Record outcomes for rolling two number cubes in order to determine what is most likely to happen. Graph the data and investigate patterns in the results,...
Prestwick House
Catcher in the Rye Activity Pack
The Catcher in the Rye is the focus of a sampler that models some of activities included in a for-purchase packet based on J. D. Salinger's novel.
Curated OER
A Research Project and Article For the Natural Inquirer
Get your class to use the scientific process to solve a scientific problem. They utilize the Natural Inquirer magazine to identify a research question which they write an introduction to and collect data to answer. They use graphs,...
Curated OER
James and the Giant Peach Plot Analysis
It's all about the plot, main events, and story mapping with this lesson. As the class reads the novel James and the Giant Peach, they create an excitement graph that actually charts key events and moments of excitement. After...
Curated OER
"The Soil Around Us" Project
Young scholars explore how to storyboard. They examine the tasks and roles involved in creating a multimedia presentation. They create a list of quality attributes for the presentation. Use the list to improve the style, accuracy and...
Florida Center for Reading Research
Fluency: Words, Speedy Rime Words
Learners time each other as they read as many rime words as possible.
Florida Center for Reading Research
Comprehension: Expository Text Structure, Text Feature Find
Scholars explore an expository text to answer questions about its structure.
PBS
Dear Pen Pal
Explore cultures from around the world with an engaging pen pal resource. Through a series of classroom activities and written correspondence, children learn about the favoritec pastimes, schooling, geography, and weather that is...
North Haven Middle School
Environmental Expert Presentation
Individuals or groups select an environmental issue, then spend time researching and creating a presentation to share in class. By allowing learners to choose the issue that matters most to them, you will motivate them to do...
Shmoop
ELA.CCSS.ELA-Literacy.SL.9-10.2
What are diverse media formats? Have your class figure this out on their own through small-group brainstorming. The resource includes two related activities about different kinds of data that will help your class get a grasp of media...
Spartan Guides
Infographics Lesson
An infographic is fantastic way for learners to illustrate their understanding of content, express themselves creatively, and teach others in a manner that is both engaging and informative. While originally designed for a lesson on...
Center for Learning in Action
Properties of Balls
Enhance your states of matter lessons with a hands-on science investigation that compares six different balls' color, texture, size, weight, ability to bounce, and buoyancy.
The Math League
The Math League: Using Data and Statistics: Pie Charts
This introductory tutorial about statistical graphing with four examples of how pie charts (circle graphs) are constructed and read.
Primary Resources
Primary Resources: Line Graphs and Pie Charts
Here are a few resources to use with your students when teaching about line graphs or pie charts.
Math Is Fun
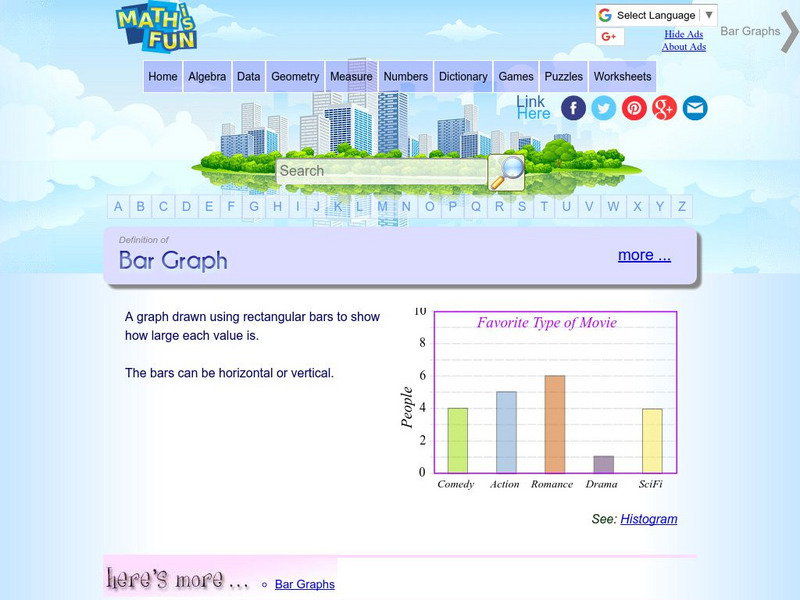
Math Is Fun: Definition of Bar Graph
Get the definition for a bar graph. Then, select the link "here's more" and use the interactive graph to display data as a bar graph, line graph or pie chart. The finished graph may be printed.
Shodor Education Foundation
Shodor Interactivate: Pie Chart
Students investigate how a pie chart can be used to display data graphically. The resource includes the activity and instructor resources.


