Curated OER
Graphing Linear Equations Using a Table of Values
Students explore the concept of linear equations. In this linear equations worksheet, students graph linear equations using tables of values. Students graph 16 linear equations.
Scholastic
Study Jams! Function Tables
Each week Mia saves a certain portion of the earnings from her babysitting job. Help her figure out how much she can save this week with a step-by-step presentation on function tables. Given a set of inputs and outputs, the process for...
CK-12 Foundation
Function Rules for Input-Output Tables: Soda Sugar Function Table
Examine the relationship between the input and output variables in a table of values. As learners build an input-output table using online manipulatives, they begin to identify patterns. They answer questions about these patterns and...
Flipped Math
Calculus AB/BC - Estimating Limit Values from Tables
There's value in using a video to analyze a table of values. Pupils learn how to find the limit of a function from a table of values in the fourth of 18 lessons in Unit 1 - Limits and Continuity. An engaging video gives a tutorial on how...
EngageNY
Comparing Ratios Using Ratio Tables
Decide which concentration of mixtures is the strongest. Pupils use tables to compare ratios involved in mixtures. They use two methods to make the comparisons — by finding equivalent values within the tables or by comparing the values...
Charleston School District
Review Unit 3: Functions
Time to show what you know about functions! The review concludes a series of nine lessons on the basics of functions. The problems included are modeled from the previous lessons. Pupils determine if a table represents a function,...
EngageNY
The Structure of Ratio Tables—Additive and Multiplicative
Build tables by understanding their structure. Scholars take a closer look at the structure of ratio tables in the 10th segment in a 29-part series. Individuals realize that the tables can be built using an additive or multiplicative...
CK-12 Foundation
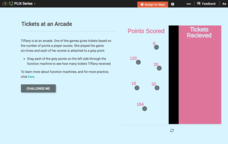
Function Rules for Input-Output Tables: Tickets at an Arcade
This is the ticket to learning about function rules! Using online manipulatives, scholars build a table of values and then answer questions about the related function. They examine the relationship between the input and output values and...
Charleston School District
Tables of Linear Functions
Don't forget the tables! The previous lessons in this five-part series examined the linear equation and graph relationship. The current lesson adds tables to the mix. At completion, individuals should be able to create a table of values,...
Curated OER
Periodic Table of Elements
In this chemistry worksheet, students use the periodic table of elements in order to identify the common elements. The detail is very detailed.
Super Teacher Tools
Periodic Table Review
This webpage sports a clever Jeopardy-style review game for the periodic table of elements. There are five columns of questions, and five rows that range in value from five to twenty points. Beneath the question selection board is a link...
CK-12 Foundation
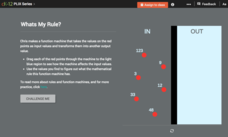
Function Rules for Input-Output Tables: Whats My Rule?
What's the rule that makes it true? A virtual function machine generates output values as learners submit the input values. Their job is to analyze the inputs and outputs for a pattern and write a function rule.
CK-12 Foundation
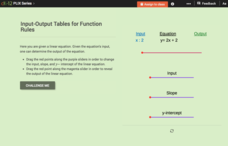
Input-Output Tables for Function Rules
Make the abstract a bit more concrete with an interactive that asks learners to slide an input value through a function to determine the output. Changing the slope and y-intercept allows them to see the how the output values change.
Curated OER
Graphing Linear Functions Two
Use this graphing linear functions worksheet to have learners graph three linear equations. They use a table of values, the intercept method, and slope-intercept form to graph three functions.
EngageNY
From Ratio Tables to Equations Using the Value of a Ratio
Use the value of a ratio to set up equations. The teacher leads a discussion on determining equations from ratio tables in the 13th portion of a 29-part series. Pupils determine which of two equations to use to find the solution. They...
EngageNY
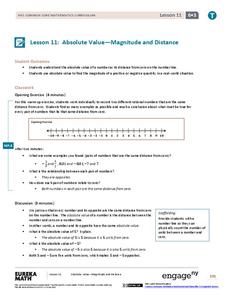
Absolute Value—Magnitude and Distance
Do you want to use the resource? Absolutely. Scholars learn about absolute value and its relation to magnitude and distance on a number line. They compare numbers in context by applying absolute value.
West Contra Costa Unified School District
Quadratic Equations — What We Know
Everything you could possibly want to know about quadratic equations, all in one resource. Instructors demonstrate how to translate between different forms of quadratics (equation, table of values, graph, verbal description) and finding...
Curated OER
Graphs and Functions
Middle schoolers describe plotting functions on the Cartesian coordinate plane. They solve functions on paper and using an online tool to plot points on a Cartesian coordinate plane creating lines and parabolas.
West Contra Costa Unified School District
Multiple Representations of Equations
class members first work through finding the equation, table of values, graph, and key features of a linear function expressed verbally. Individuals then work through several more problems given different representations.
CK-12 Foundation
Input-Output Tables for Function Rules
How does changing a graph affect the function? Learners watch the changing input-output table as they adjust the location of the line graph. Questions prompt them to complete a table of values and determine the function rule.
CPM
Tables, Equations, and Graphs
Eighth and ninth graders solve and graph 24 different problems that include completing input/output tables and graphing the pairs. First, they find the missing values for each table and write the rule for x. Then, students write the...
Fun Music Company
Note Values
Note values are the focus of a short worksheet that asks young musicians to respond to short-answer questions and to complete a measure with notes of the appropriate value.
EngageNY
From Ratio Tables, Equations and Double Number Line Diagrams to Plots on the Coordinate Plane
Represent ratios using a variety of methods. Classmates combine the representations of ratios previously learned with the coordinate plane. Using ratio tables, equations, double number lines, and ordered pairs to represent...
EngageNY
Building Logarithmic Tables
Thank goodness we have calculators to compute logarithms. Pupils use calculators to create logarithmic tables to estimate values and use these tables to discover patterns (properties). The second half of the lesson has scholars use given...


