Curated OER
Microbial Spoilers: The Impact of Microorganisms on the Shelf-life of Milk
Students are inroduced to a commonly used microbial culturing technique. They explore the role of microorganisms in determining the shelf-life of food products.
Curated OER
Measuring Water Quality
Students are introduced to the various methods of measuring water quality. In groups, they test various water samples using the different methods, writing them down for pH, oxygen, salinity, and nitrate levels. They use their data to...
Curated OER
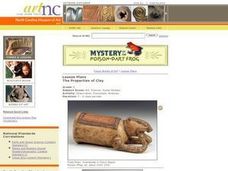
The Properties of Clay
Sixth graders determine the physical properties of clay by examining ceramic works of art. They evaluate local soil samples for suitability for sculpting and compare clay taken from soil to manufactured clay.
Curated OER
Artificial Selection
The second lesson in the series begins with a starter activity discussing wild versus domesticated animals. Then, scholars play a card game, with optional variations, to emphasize artificial selection. Next, they attend a field trip to a...
American Statistical Association
Step into Statastics
Class members study the size of classmates' feet and perform a statistical analysis of their data. They solve for central tendencies, quartiles, and spread for the entire group as well as subgroups. They then write a conclusion based on...
EngageNY
More Practice with Box Plots
Don't just think outside of the box — read outside of it! The 15th lesson in a 22-part unit provides pupils more work with box plots. Learners read the box plots to estimate the five-number summary and interpret it within the context....
Noyce Foundation
Baseball Players
Baseball is all about statistics. Pupils solve problems related to mean, median, and range. They calculate the total weight of players given the mean weight, calculate the mean weight of reserve players given the mean weight of the...
EngageNY
Distributions and Their Shapes
What can we find out about the data from the way it is shaped? Looking at displays that are familiar from previous grades, the class forms meaningful conjectures based upon the context of the data. The introductory lesson plan to...
Curated OER
Mark, Recapture, Sampling
Learners conduct a simulation to explore how scientists estimate the size of animal populations. They analyze a random sample and then extrapolate those results to a larger population. Additionally, they will apply the principals of...
Massachusetts Department of Education
Nostalgia
To prepare for crafting their own memoir, class members examine poetry by Margaret Atwood, Billy Collins, Robert Hayden, and Claude McKay, stories by Richard Rodriquez and Willa Cather, and Barry Levinson's film Avalon. They examine how...
American Statistical Association
Confidence in Salaries in Petroleum Engineering
Just how confident can we be with statistics calculated from a sample? Learners take this into account as they look at data from a sample of petroleum engineer salaries. They analyze the effect sample size has on a margin of error and...
National Park Service
It Was a Very Good Year
Waterton-Glacier International Peace Park includes whitebark pines that are over 1,200 years old, meaning they have been there since before medieval times. The second lesson of five details how to read tree rings for climate change and...
American Statistical Association
Chunk it!
Chunking information helps you remember that information longer. A hands-on activity tests this theory by having learners collect and analyze their own data. Following their conclusions, they conduct randomization simulations to test...
Curated OER
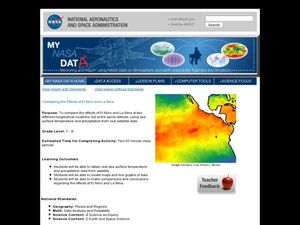
Comparing the Effects of El Nino and La Nina
Students examine the differences between an El Nino and La Nina year. For this investigative lesson students create maps and graphs of the data they obtained.
Nuffield Foundation
Investigating Factors Affecting the Heart Rate of Daphnia
What variables change heart rate? Young scientists observe the beating heart in Daphnia to understand these variables. They make changes in temperature, chemicals, and other factors as they graph the heart rates. Analysis questions help...
Curated OER
Mean Absolute Deviation in Dot Plots
The lesson focuses on the ideas of dot plot representations and the mean absolute deviation of data sets.
Curated OER
DNA Diagnosis
Students describe the fundamentals of DNA such as structure and replication. Given a picture of a gel, they circle the band that represents the smallest DNA, the largest DNA, and show which DNA sources are the same.
Curated OER
Algebra 1
Students study the functional relationships of a variety of problems. In this functional relationship lesson, students determine the dependent and independent quantities of a given set of data. Students record the data and write it in...
Curated OER
Election Poll, Variation 2
When a random sample isn't enough, your math class can compare the data from a physical simulation to decide if the probability is still likely. The lesson plan is part of a probability series that focuses on one question and different...
Curated OER
Michigan Virtual Field Trip
Students analyze data from a virtual field trip to Michigan. They conduct Internet research on mileage and travel time between cities, calculate and compare fuel costs, and research and calculate lodging, activities, and meal costs.
Curated OER
Which Amusement Park Would You Choose?
Students analyze data related to amusement parks and create a spreadsheet to display the data. They read the data and predict which amusement park they think is safer, create a spreadsheet and graph, and write a proposal based on their...
Curated OER
Hypothesis Testing: Two Sample Tests
Students experiment and compare results of two populations. For this men and women populations lesson, students examine the difference in hand span for men and women. Students calculate a norm based on their results. Students complete...
Curated OER
Body Voyager
Students explore the significance of a resting and an active heart rate. In this heart lesson students chart data on their pulse and draw a diagram of the heart.
Curated OER
Time Travel
Students view a video clip on time travel. They work together to complete a worksheet on measuring time. They discuss the different perceptions of time.


