Curated OER
Math On the Job
Investigate different types of math required for specific jobs. In this math in occupations lesson, use the Internet to research what type of math one might need to know in order to be successful in different jobs. Complete a...
Illustrative Mathematics
How Many _______ Are In. . . ?
Help your learners gain meaningful understanding of dividing fractions using fraction models. The activity includes nine problems which are sequenced to show how the fraction division algorithm evolves. Have students use graph paper or...
Bowland
Fruit Pies
Scholars use formulas for the area of a circle and the area of a rectangle to determine the number of pies a baker can make from a particular area of dough. They must also take into account rolling the remaining dough into a new sheet.
Statistics Education Web
How Wet is the Earth?
Water, water, everywhere? Each pupil first uses an Internet program to select 50 random points on Earth to determine the proportion of its surface covered with water. The class then combines data to determine a more accurate estimate.
Curated OER
Making a Cartogram
Students interpret statistical geographic information by creating a cartogram.
Curated OER
Algebra I: Linear Functions
Using rates from a rental car company, young mathematicians graph data, explore linear relationships, and discuss the role of slope and the y-intercept. This lesson allows for the discussion of independent and dependent variables, as...
Curated OER
Understanding "The Stans"
Young scholars explore and locate "The Stans" in Central Asia to create, write and illustrate maps, graphs and charts to organize geographic information. They analyze the historical and physical characteristics of Central Asia via...
Curated OER
Radiation Comparison Before and After 9-11
Using the NASA website, class members try to determine if changes could be detected in cloud cover, temperature, and/or radiation measurements due to the lack of contrails that resulted from the halt in air traffic after the attacks...
Virginia Department of Education
Mineral Identification
What's the difference between a rock and a mineral? And what properties are used to identify minerals? The first installment of a five-part series on earth materials and processes prompts young scientists to identify a set of...
Virginia Department of Education
Permutations and Combinations
Counting is not all it adds up to be — sometimes it involves multiplying. The lesson introduces permutations and combinations as ways of counting, depending upon whether order is important. Pupils learn about factorials and the formulas...
Alabama Learning Exchange
The World of Integers
Review operations related to rational numbers and integers using the include PowerPoint presentation, "Interesting Integers." Young mathematicians classify rational numbers as being natural, whole, or integers and read an article about...
Curated OER
Algebra 1: Slope as Rate
Students solve problems with slopes. In this algebra lesson, students identify the slope of a line and relate it to the rate of change. They graph their lines on the TI and observe changes in the lines.
American Statistical Association
What is the Probability of “Pigging Out”
Learners apply their understanding of luck to a probability experiment. They play a game of Pass the Pigs to determine the probability of a specific outcome. Using analysis for their data, pupils declare the measures of center, dot...
Statistics Education Web
Population Parameter with M-and-M's
Manufacturers' claims may or may not be accurate, so proceed with caution. Here pupils use statistics to investigate the M&M's company's claim about the percentage of each color of candy in their packaging. Through the activity,...
Curated OER
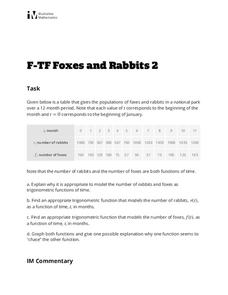
Foxes and Rabbits 2
Explore the relationship between the population of foxes and rabbits in a national park using trigonometric models. Plot data and find the appropriate trigonometric functions. Two questions require interpretation and explanation of...
Curated OER
Rates of Chemical Reactions-The Iodine Clock Reaction
Learners investigate the reaction rate of iodine and soluble starch. In this rates of chemical reactions lesson plan, students study the effects of varying concentrations of reactants and varying temperatures of reactants on the reaction...
Virginia Department of Education
Solar System Model
How many planets can you name? Did you get all 13 in our solar system, including the dwarf planets, or were you surprised when you read there are 13 planets? The lesson helps scholars understand the scale of the universe including the...
Tech Museum of Innovation
Human Body Exhibit
Explore human anatomy and physiology using models. Scholars study systems of the human body and design a display for a museum exhibit. To complete the activity, individuals create analogous models of their chosen human body systems.
NASA
Development of a Model: Analyzing Elemental Abundance
How do scientists identify which elements originate from meteorites? Scholars learn about a sample of material found in a remote location, analyzing the sample to determine if it might be from Earth or not. They study elements, isotopes,...
Serendip
Changing Biological Communities – Disturbance and Succession
After cutting down a forest to make a farm, how long would it take the environment to turn an abandoned farm back into a forest? Scholars study this exact scenario while they interpret many charts and graphs of the changing ecosystems as...
New York City Department of Education
Grade 5 Literacy in Science: Ecosytems
How do humans affect ecosystems? Learners read two articles and interpret a graph to develop essays on the human impact on ecosystems. They read about human impact on tigers and manatees as a basis for their overarching papers.
Math Drills
Multiplication Five Minute Frenzy (E)
How fast can you multiply one- and two-digit numbers? Have kids keep track of their success as they work on these math drills. Each grid features ten numbers on the x axis that kids can multiply by the ten numbers on the y axis.
Curated OER
Snow Cover By Latitude
Pupils examine computerized data maps in order to create graphs of the amount of snowfall found at certain latitudes by date. Then they compare the graphs and the data they represent. Students present an analysis of the graphs.
Curated OER
The Tale of Scale
Eighth graders, using a range of data, produce three bar graphs for various scales along the y-axis.


