Curated OER
Analysing 2001 Census Microdata
Eighth graders examine the census data of 2001. In this American History lesson, 8th graders analyze data using one- and two-variable statistical analysis. Students develop a research question that makes use of the microdata.
Curated OER
2006 Census Teacher's Kit: Web of Consequenses
In this data analysis worksheet, students use a graphic organizer to show the things that have changed over the years and the consequences of these changes using the 2006 Census data. Students show the changes and direct consequences in...
Concord Consortium
People and Places
Graph growth in the US. Given population and area data for the United States for a period of 200 years, class members create graphs to interpret the growth over time. Graphs include population, area, population density, and population...
Curated OER
Exploring Our Country: An United States Scavenger Hunt
Students visit a selected web site and search answers to given questions. They investigate census data for a several states. They explore data such as business, geography, and people. Students demonstrate ways to navigate through a...
Curated OER
US Airports, Assessment Variation
Determining relationships is all part of algebra and functions. Your mathematicians will decide the type of relationship between airports and population and translate what the slope and y-intercept represent. The problem is multiple...
Curated OER
US Households
Learners construct and use inverse functions to model a real-world context. They use the inverse function to interpolate a data point.
Curated OER
US Population 1982-1988
Your algebra learners make predictions using the concepts of a linear model from real-life data given in table form. Learners analyze and discuss solutions without having to write a linear equation.
DocsTeach
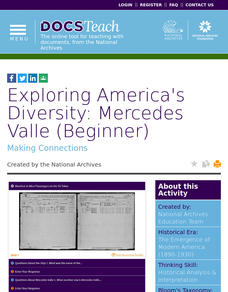
Exploring America's Diversity: Mercedes Valle (Beginner)
An enlightening activity focuses on the life of Mercedes Valle, an immigrant from Ecuador. Scholars analyze ships and census records to understand the life of Mercedes Valle. In addition, they participate in a group discussion and...
Curated OER
It's About You
Young scholars explore the U.S. Census and come to understand more about it. In this census lesson, students build reading confidence, explain who is counted in the census, and recognize the connection between census information and...
Curated OER
It's About You
Students build connections between census information and community decision-making by reading a reader's theater script. In this reader's theater lesson, students practice reading fluently and learn about the government. The reader's...
Curated OER
A Look at the Population Density of the United States
Students acquire census information and create maps of the population density of the United States on different scales. They role play the roles of workers of a retail company and they use the population data to market to their customers.
Curated OER
Mapping Districts
Learners become literate in their use of maps. In this 2010 Census lesson plan, students visualize census data on maps, use map keys to read population maps, and explore the concept of population density.
Curated OER
Mapping Districts
Students use maps to learn about the U.S. Census. In this 2010 Census lesson plan, students visualize census data on maps, use map keys to read population maps, and explore the concept of population density.
Curated OER
2006 Census Teacher's Kit: Consequences Report Card
In this analyzing the Census worksheet, students assess the consequences of change using data from the 2006 Census. Students analyze the economic, social, and political wellbeing of each stakeholder.
Curated OER
Farm Census
Students disuss the work of a farmer. They recognize and name farm animals to represent the information in a pictogram.
US Department of Commerce
Educational Attainment and Marriage Age - Testing a Correlation Coefficient's Significance
Do women with college degrees get married later? Using a provided scatter plot of the percentage of women who earn bachelor's degrees and the median age at which women first get married over time, pupils conduct a linear regression...
Curated OER
What's the Point?
Students learn why the census makes a difference. In this U.S. Census lesson plan, students identify who uses census data and how, trace the impact of census data from Census 2000, and present findings in a graphic format.
Curated OER
Numbers Tell a Story
Students connect census data to historical events. In this civics lesson plan, students understand cause and effect, and how they are reflected in census data and analyze census data for social and economic significance.
Curated OER
Analyzing the Job Market for Babysitting in Your Neighborhood
Students conduct research on a neighborhood in Canada. In this data analysis lesson plan, students use data from the 2006 Canadian census to draw conclusions about a population group.
Smithsonian Institution
Changing Gender Roles on the Home Front
Many historians discuss how gender roles changed because of World War II, but how did this come to be? An informative resource challenges scholars to do some digging and research the information for themselves. They research how...
PBS
What We Do Adds Up
With so many tons of trash going into landfills each year, your environmentalists can calculate how much the average person is tossing away. This activity has a series of questions not only requiring math, but a conscious thought of how...
US Department of Commerce
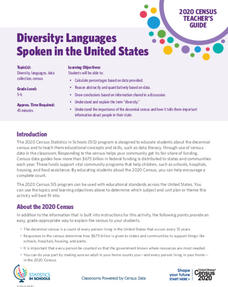
Diversity: Languages Spoken in the United States
High schoolers begin a discussion on diversity and determine the percent of the population that speak another language at home in the US. Classmates make a prediction of the percentage of people that speak another language at home in...
US Department of Commerce
Over the Hill - Aging on a Normal Curve
Nobody is too old to learn something new. Young statisticians analyze census data on the percentage of the population older than 65 years old in US counties. They fit a normal distribution to the data, determine the mean and standard...
Other popular searches
- Us Census Bureau
- Us Census Activity
- 2010 Us Census
- Us Census Graphing
- Us Census Native American
- Government Us Census
- Linear Regression Us Census
- Analyzing Us Census Data
- Us Census African Americans
- Us Census Worksheets
- Us Census Lesson Plans
- History of the Us Census


