Curated OER
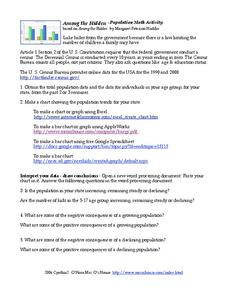
Among the Hidden - Population Math Activity
In this population worksheet, students collect data on population by researching the Census Bureau and then make online graphs and answer short answer questions about the data. Students complete 5 problems total.
Curated OER
US City Quality of Life Analysis and Comparison
Students analyze US census data and criteria to compare and measure the quality of life in the country's fifty largest cities. After accessing the 2005 quality of life world report online, students conduct their study to compare three...
Curated OER
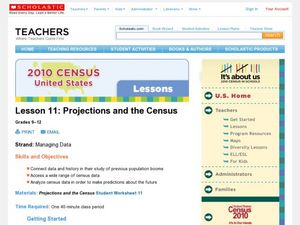
Projections and the Census
Students learn why the census makes a difference. In this U.S. Census lesson plan, students connect data and history in their study of previous population booms and analyze census data in order to make predictions about the future.
Willow Tree
Line Graphs
Some data just doesn't follow a straight path. Learners use line graphs to represent data that changes over time. They use the graphs to analyze the data and make conclusions.
Curated OER
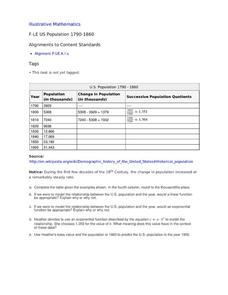
US Population 1790-1860
Your young population scientists analyze a table of values, write a model to represent the real life data, finish the table of data and predict future populations in a collaborative, real-life activity.
Curated OER
Little House in the Census: Almanzo and Laura Ingalls Wilder
How would you use census data from 1880-1900? Here are a set of ways you can incorporate the book Little House on the Prairie and US census data from that time period. Learners will research the validity or the book based on factual...
Curated OER
The Demographics of Immigration: Using United States Census Data
Students work together to analyze United States Census data on immigration. They compare and contrast the data and determine how immigration numbers have changed over time. They calculate percentages and make their own conclusions...
Curated OER
Recognizing and Combating Segregation in U.S. Schools Today
Students explore the prevalence of racism and statistical segregation in America's schools. They design a project to investigate how the racial makeup of their school compares to other schools. In addition, they evaluate their design...
Curated OER
A Look at the Population Density of the United States
Students acquire census information and create maps of the population density of the United States on different scales. They role play the roles of workers of a retail company and they use the population data to market to their customers.
Curated OER
What's in a Number? Analyzing Smoking Statistics
Sixth and seventh graders analyze smoking statistics. In this health lesson plan, learners look at the percentage of people who smoke from each race group. They create a bar graph and circle graph that displays this information.
Curated OER
Size It Up: Map Skills
Compare information from a US population cartogram and a standard US map. Learners draw conclusions about population density by analyzing census data a population distribution. They discover that census data is used to apportion seats in...
Curated OER
Race and Ethnicity in the United States
Students explore race and ethnicity as it is defined by the U. S. Census Bureau. They compare data from 1900, 1950, and 2000 and identify settlement patterns and changes in population. In groups, they map these changes and discuss...
Curated OER
Graphically Speaking
Students discover the links between population and Congressional representation. In this government lesson, students research population statistics and create spreadsheets that compare population to the number of Congress members per state.
Curated OER
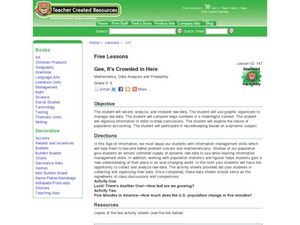
Gee, It's Crowded in Here
Students interpret raw data about population statistics. In this raw data lesson plan, students plug the data into graphic organizers and draw conclusions based on their findings.
Curated OER
Slavery: Population Growth in Arkansas
Eighth graders examine the number of slaves in Arkansas in each census period from 1820 to 1860. They graph the data using the proper labeling and write a paragraph summarizing the data from each period making comparisons between slave...
Curated OER
Population Histograms
Students interpret population growth patterns from population histograms.
Curated OER
Where Do I Want To Live?
Learners use a variety of Internet sources to gather income, population and housing data. Each group bring their results to the class and the class use their findings to compile mean population, income, and housing for all states.
Curated OER
Plotting Slave Population Density in Connecticut in the 1700's
Tenth graders explore slavery in the U.S. by researching the web. In this U.S. history instructional activity, 10th graders identify the geography of Connecticut and the overall involvement the state had in the slavery process. Students...
Curated OER
More of U.S.
Explore graphical representation of a real-life data set and determine the exponential regression model for the data in your classroom. High schoolers also compare the estimated value to the given value by determining the percent error.
Curated OER
Human Population Ecology: Demography
Students describe the basic concepts of population demography. They collect a wide range of data from an online cemetery database including a variety of places across the U.S. They analyze factors that may have affected human demography...
Curated OER
Populations in the Path of Natural Hazards
Students read "Geographical Mobility: 1995-2000." They examine the maps in the handouts and compare them with maps from an atlas. In the second part of this lesson, students read "In Harm's Way." They receive three more handouts, one a...
Curated OER
Cities
Students examine U.S. Census figures. In this urban centers activity, students compare city populations across the span of 50 years. Students create line graphs based on the data.
Curated OER
Mapping Population Changes In The United States
Students create a choropleth map to illustrate the population growth rate of the United States. They explore how to construct a choropleth map, and discuss the impact of population changes for the future.
Curated OER
Numbers Tell a Story
Students connect census data to historical events. In this civics lesson plan, students understand cause and effect, and how they are reflected in census data and analyze census data for social and economic significance.


