Curated OER
Intercepting Villans Using the Correct Rate
A Cyberchase video introduces the distance = rate x time equation. Participants then calculate answers to proposed problems and graph a series of results that is then incorporated into a game to help cement the concept. A thorough and...
Curated OER
Water Chestnut Graphing Activity
Students are taught how to format and enter data into an Excel spreadsheet. They make a graph and interpret graphed data. Students discuss possible impacts of water chestnut invasion. They graph data on water chestnut. Students report...
Physics Classroom
Position-Time Graphs
Three sections review the key skills covered in a series on dimensional kinematics. The first covers the difference between distance and displacement. The second addresses the relationship between velocity and slope. The third includes...
CK-12 Foundation
Least Time
What is the fastest way to get from point A to point B if you are going through two different mediums, such as air then water? Scholars explore the way light travels through air, water, acrylic, glass, and diamond as they answer this...
CPO Science
Physics Skill and Practice Worksheets
Stop wasting energy searching for physics resources, this comprehensive collection of worksheets has you covered. Starting with introductions to the scientific method, dimensional analysis, and graphing data, these skills practice...
Curated OER
Unit II: Worksheet 1 - Velocity
Beginning physics scholars interpret two graphs depicting position versus time. For each graph, there is a series of questions to answer. The exercise is basic, but beneficial. Consider using it as an assessment of understanding after...
Curated OER
Environmental Agents of Mathematics: Mathematics for Change
High schoolers analyze environmental science data using Math. They do research about renewable energy, gather data, create graphs and interpret their findings. Then the group presents their arguments persuasively using their findings to...
Curated OER
Busted Bubbles
Using the scientific method, and bubble gum, learners conduct a motivating experiment. After conducting a series of tests involving bubble gum, they graph and analyze their results. This is the type of activity everyone loves.
Curated OER
Review Linear Equations
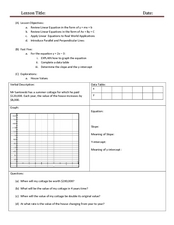
Explore algebra I/algebra II with this series of worksheets. Pupils write linear equations in slope-intercept and standard form, graph linear equations, and apply linear equations to real world applications. The six-page learning...
California Education Partners
Science Fair Project
Plant the data firmly on the graph. Given information about the growth rate of plants, pupils determine the heights at specific times and graph the data. Using the information, scholars determine whether a statement is true and support...
CK-12 Foundation
Cliff Diver
Cliff diving is more than an adrenaline rush ... it's a lesson in physics! Scholars adjust the height of a cliff and plot the resulting velocity and position over time on graphs. They also can incorporate air resistance to monitor the...
Curated OER
Is the Hudson River Too Salty to Drink?
Students explore reasons for varied salinity in bodies of water. In this geographical inquiry lesson, students use a variety of visual and written information including maps, data tables, and graphs, to form a hypothesis as to why the...
Curated OER
Position and Time Graphs
A series of graphs are displayed with points plotted for time and position. A question is asked for each, requiring your class to view one axis and track its partner coordinate. A few examples are given to begin each section, and so this...
Curated OER
Graphing Linear Equations on the TI-73
Eighth graders work in pairs with a TI-73 graphing calculator to complete a multiple-choice review using the Classroom Performance System. Each team uses a remote unit to "click in" the answers. When all teams have completed the review,...
Common Core Sheets
Determining Coordinates: Reading Positive & Negative Coordinates
For kids who have a hard time with graphing, a grid with coordinates can look like an unsolvable puzzle. A series of worksheets uses symbols and shapes like hearts, stars, and letters to help kids find the correct coordinates.
Curated OER
Instantaneous Rate of Change of a Function
Pupils draw the graph of a door opening and closing over time. They graph a given function on their calculators, create a table of values and interpret the results by telling if the door is opening or closing and evaluate the average...
Curated OER
Line Graphs
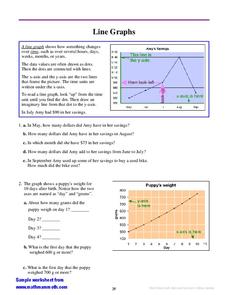
For this interpreting line graphs worksheet, students read an explanation and observe an example of a line graph and its parts and then answer questions interpreting two line graphs. Students write eleven answers.
Curated OER
Graphing Using Excel
Fifth graders complete a series of graphs by gathering information and using Excel to graph the information. In this graphing lesson plan, 5th graders graph favorite desserts of the class. Student put their results into the computer and...
National Security Agency
Line Plots: Frogs in Flight
Have a hopping good time teaching your class how to collect and graph data with this fun activity-based lesson series. Using the provided data taken from a frog jumping contest, children first work together creating a line plot of the...
Inside Mathematics
Squares and Circles
It's all about lines when going around. Pupils graph the relationship between the length of a side of a square and its perimeter. Class members explain the origin in context of the side length and perimeter. They compare the graph to the...
Chicago Botanic Garden
Plant Phenology Data Analysis
Beginning in 1851, Thoreau recorded the dates of the first spring blooms in Concord, and this data is helping scientists analyze climate change! The culminating instructional activity in the series of four has pupils graph and analyze...
EngageNY
Constant Rates Revisited
Find the faster rate. The resource tasks the class to compare proportional relationships represented in different ways. Pupils find the slope of the proportional relationships to determine the constant rates. They then analyze the rates...
Chicago Botanic Garden
Plant Phenology Data Analysis
Scientists monitor seasonal changes in plants to better understand their responses to climate change, in turn allowing them to make predictions regarding the future. The last activity in the series of six has scholars analyze BudBurst...
Concord Consortium
Here Comes the Sun
Many phenomena in life are periodic in nature. A task-based lesson asks scholars to explore one of these phenomena. They collect data showing the sunrise time of a specific location over the period of a year. Using the data, they create...


