Annenberg Foundation
Skeeters Are Overrunning the World
Skeeters are used to model linear and exponential population growth in a wonderfully organized lesson plan including teachers' and students' notes, an assignment, graphs, tables, and equations. Filled with constant deep-reaching...
Willow Tree
Line Graphs
Some data just doesn't follow a straight path. Learners use line graphs to represent data that changes over time. They use the graphs to analyze the data and make conclusions.
Curated OER
A Data Processing Lesson for Statistics -- Reading a Table or Chart
Students identify the structure and key parts of tables and charts. They determine which data is meanjngful and make comparisons with the data. They describe the scope of the AIDS plague throughout the world.
Inside Mathematics
Conference Tables
Pupils analyze a pattern of conference tables to determine the number of tables needed and the number of people that can be seated for a given size. Individuals develop general formulas for the two growing number patterns and use them to...
Curated OER
Comparing Data on Graph A and Graph B
Second graders gather and graph data. In this graphing lesson, 2nd graders collect data and graph this information using tally charts, bar graphs, pictographs, or tables. They make predictions about the outcomes.
Curated OER
Build A Skittles Graph
Students explore graphing. In this graphing lesson, students sort Skittles candies and use the color groups to create a bar graph. Rubrics and extension activities are provided.
Curated OER
Graphing Fun In Third Grade
Third graders display information in a graph, table, and chart. In this data lesson plan, 3rd graders look at graphs, tables, and charts, discuss their importance, and make their own.
Willow Tree
Histograms and Venn Diagrams
There are many different options for graphing data, which can be overwhelming even for experienced mathematcians. This time, the focus is on histograms and Venn diagrams that highlight the frequency of a range of data and overlap of...
West Contra Costa Unified School District
Multiple Representations of Equations
class members first work through finding the equation, table of values, graph, and key features of a linear function expressed verbally. Individuals then work through several more problems given different representations.
Los Angeles County Office of Education
Assessment for the California Mathematics Standards Grade 5
Test young mathematicians' knowledge with an assessment aligned to California's fifth grade state standards. The exam covers a multitude of concepts including fractions and decimals, positive and negative numbers, measurement; and how to...
Curated OER
Integrated Algebra Practice: Frequency Histograms, Bar Graphs and Tables
For this graphs worksheet, students solve 4 problems about histograms, bar graphs, and tables. Students answer questions about histograms, bar graphs, and tables.
Curated OER
Graphing Data
Second graders graph data about their classmates. In this data analysis lesson, 2nd graders ask each other several questions about their hair color and eye color. Students graph the data that they collected.
Curated OER
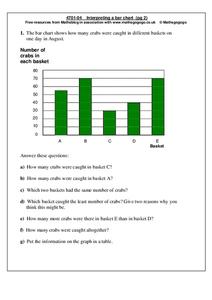
Interpreting a bar chart
For this bar chart worksheet, students analyze a bar chart and answer 7 questions pertaining to the information on the chart. The answers are on the second page.
Curated OER
Bar Graphs
Third graders investigate bar graphs. In this third grade mathematics lesson, 3rd graders collect and analyze data and use the internet’s Graph challenge to create their own graphs. Students write questions for the other students to...
Curated OER
Data Handling: Tally Chart on Illnesses
In this tally chart worksheet, students analyze a chart showing childhood illness cases. Students use the tally chart to solve 6 problems.
Curated OER
Tally Chart: Favorite Names
In this data display learning exercise, students analyze a tally chart of favorite hamster names. Using the information on the chart, students solve 8 word problems.
Curated OER
Students Favorites
Learners complete activities using a frequency table and construct a pie graph for the data. In this frequency table lesson, students complete a survey to find data for a frequency table. Learners use the given link to make a pie graph...
Curated OER
Comparing School Bus Stats
Engage in a lesson plan that is about the use of statistics to examine the number of school buses used in particular states. They perform the research and record the data on the appropriate type of graph. Then they solve related word...
Curated OER
Cutting Expenses
Students explore budgeting. In this finance and math lesson, students brainstorm ways in which households could save money. Students view websites that give cost reducing ideas. Students complete an expense comparison chart and use the...
Curated OER
Systems of Equations and Inequalities
This is a comprehensive lesson on creating and solving equations and systems of equations and inequalities. Problems range from basic linear equations to more complex systems of equations and inequalities based on a real-world examples....
Curated OER
Data Handling
In this data handling instructional activity, students interpret data found in table, graphs and charts. They organize data and draw bar charts. This two-page instructional activity contains 2 multi-step problems.
Curated OER
Making Predictions from Data with a Graphing Calculator
For this making predictions from data worksheet, high schoolers solve 15 short answer problems. Students determine average miles per gallon given data on miles traveled and gas used. High schoolers make predictions using the data and a...
Curated OER
When Ants Fly
Here is a great lesson on constructing line graphs. Learners identify common characteristics of birds, ants common needs of all living things. They also write a story from the perspective of an ant or a bird that has lost its home and...
Curated OER
Hats for Sale
What type of hat do you think sells the best? Elementary learners will use the picture graph provided to answer the comprehension questions. A chart accompanies the picture graph, so youngsters can see the data multiple ways.
Other popular searches
- Tables, Charts and Graphs
- Tables Charts and Graphs
- Tables, Graphs, Charts
- Graphs Charts Tables
- Tables, Charts, Graphs
- Maps, Charts, Graphs, Tables
- Charts, Graphs and Tables


