Curated OER
Reading Tally Chart
As learners explore data analysis have them practice reading tally charts using these examples. They answer basic questions about each of three charts, employing addition and subtraction skills. For example, a chart tallying t-shirts...
Curated OER
Data Analysis: For Little Learners
Using pictographs, tally charts, and surveys, kids learn all about data analysis and collection. They make surveys, collect data, then construct pictographs and tally charts to organize their information.
Curated OER
Sweet Data
Students input data about the colors of their serving of M&M candies onto a spreadsheet. They create charts and graphs based on this information.
Curated OER
Using Computer for Statistical Analysis
Students use the computer and S'COOL data for statistical analysis.
US Department of Agriculture
Sink or Float?
Will it sink or will it float? Learners predict the outcome as they drop random objects into a container of water. Then, they keep track of the results and record the data in a t-chart to draw a final conclusion.
NASA
Using Models in Climate Change Research
Explore models through the relevant lens of climate change! Investigators watch a video about using models and their application for evaluating temperature data and climate change. Scientists read an article on climate change and answer...
Houston Area Calculus Teachers
Collecting Driving Data
Give AP Calculus classes the opportunity to check the accuracy of their calculations! A calculus activity involves the collection of data, the application of mathematics, and the analysis of the accuracy of results. Young mathematicians...
Curated OER
Data Management and Probability: Applications
For this data management and probability applications worksheet, 8th graders solve 20 various types of probability problems. They find the mean, median, mode and range of various numbers. Then, students use the spinner illustration to...
Curated OER
TV Survey - Data Collection and Analysis
In this data collection and analysis worksheet, 4th graders complete a tally chart about the number of hours that fourth graders watch television. They create a bar graph with the information, write a paragraph about the survey results,...
American Institutes for Research
Data and Probability: Marshmallow Madness
Upper grade and middle schoolers make predictions, collect data, and interpret the data as it relates to the concept of probability. They work with a partner tossing marshmallows and recording if they land on their side or on their...
Curated OER
Using Your Marbles - Volume Measurement and Reporting
Demonstrate how to measure the volume of liquids and solids immersed in liquid to your class. They observe a teacher-led demonstration, and in small groups construct a data table that demonstrates how many marbles were used and the...
National Security Agency
Line Graphs: Gone Graphing
Practice graphing and interpreting data on line graphs with 36 pages of math activities. With rationale, worksheets, and assessment suggestions, the resource is a great addition to any graphing unit.
Curated OER
Excel Turns Data Into Information
Students use excel to analyze data. In this technology lesson, students enter data into the excel program to find averages and organize data.
Curated OER
Data Collection and Presentation
Students concentrate on discrete quantiative data. They are shown that the vertical line diagram as a more appropriate way to present discrete quantiative data then bar charts. Students work as a group to help with the interpretation...
Curated OER
Graphing Data
First graders learn how to display data using a bar graph. In this bar graph lesson, 1st graders use data from a t-shirt color survey to make a bar graph. They also make an animal bar graph before interpreting the information.
Curated OER
Collecting And Organizing Data
In this collecting and organizing data worksheet, students, with a partner, problem solve and calculate the answers to six mathematical word problems.
Curated OER
How to Draw a Bar Chart Correctly
Your class has gathered their data, so what's the next step? They need to display and analyze their data, and a bar chart is a perfect tool for the job. This resource provides the step-by-step instructions those kids need to construct a...
Curated OER
How Much Will I Spend On Gas?
Students construct a linear graph. In this graphing lesson, students determine a monthly budget for gasoline. Students construct a t-chart and coordinate graph to display data. Resources are provided.
Curated OER
Indoor Gardening by Building a Simple Hydroponics
Students investigate the use of hydroponic gardening on the world food supply. In this hydroponic gardening lesson plan, students make a garden out of a soda bottle, grow a cilantro plant, and compare hydroponics with regular gardening...
Curated OER
Sensitive Taste Test
Fifth graders investigate concentrated and diluted solutions by conducting a taste test. In this dilution lesson, 5th graders examine the concentration of different juices samples by tasting them and recording their observations....
University of Kansas
Newspaper in the Classroom
Newspapers aren't only for reading—they're for learning skills, too! A journalism unit provides three lessons each for primary, intermediate, and secondary grades. Lessons include objectives, materials, vocabulary, and procedure, and...
Curated OER
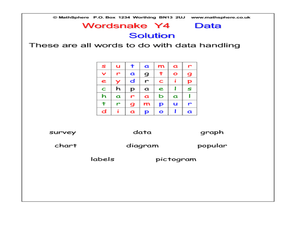
Word Snake: Data
In this data worksheet, learners search for words in a word snake, which works like a maze, for words that represent data. Students search for 8 words.
Curated OER
You Be The Census Taker
Students interpret information from an excerpt of the 1870 U.S. Census and compare that data to economic data they collect about local businesses in their own community. Students then evaluate how closely linked their community's economy...
Curated OER
Heads & Tails Data Collection
In this data collection worksheet, students use a penny and a dime to play a math game. Students flip the money in the cup and then record the number of heads and tails showing marking the coins in the box.


