Mathematics Vision Project
Module 8: Statistics
What does it mean to be normal in the world of statistics? Pupils first explore the meaning of a normal distribution in the eight-lesson module. They then apply the statistics related to normal distributions such as mean, standard...
Curated OER
Surveying and Assessing the Environmental Compatibility of a Building Construction Site
Students examine an area of land and assess its suitability for construction purposes. This project requires a vast amount of hands-on experimentation, data analysis, community involvement, and job shadowing/career awareness.
Missouri Department of Elementary
What Are Bullying And Harassment? Part 1
A brief survey begins a lesson that challenges scholars to answer the question, What is bullying? Learners discuss their answers and take notes, paying close attention to the types of bullying and roles people play. Pupils change their...
US Geological Survey
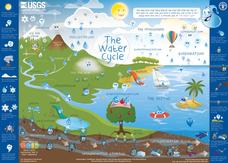
Water Cycle Poster
How many parts make up the water cycle? How many things on Earth rely on water as a system? Learn more about the water cycle in an informative and colorful poster. Print and hang, or project the graphic in the classroom for optimal use.
Purdue University
The Represented World: Recreational STEM
How are forces and motion important to a swing set? Scholars explore the concepts of force and motion using swing sets. In preparation for their own STEM design project, individuals take surveys and data from peers, complete labs on...
Curated OER
Jelly Bracelets: Fashion or Sex Game?
Ever-changing fashion fads are the ideal context for an engaging sociology experiment for adolescents. Through research and conducting a survey, learners draw conclusions about the controversial jelly bracelets fad, banned in some...
Curated OER
Canadian Social Trends
Young scholars use surveys to explore how to design graphs, tables, and diagrams. They discuss articles which can stimulate ideas for research topics, or surveys of their own.
Curated OER
The Fisherman and His Wife
Students will conduct a survey, using the information collected they will construct a poster.
Curated OER
Race To Win Project
Middle schoolers develop proper work and personal skills that will enable them to become competent and confident adults. Students analyze basic nutritional habits. Middle schoolers evaluate sport/athletic food patterns.
Virginia Racing Commission
Project Hoofbeat: Incorporating the Horse in the Classroom:
It's all about horses in this cross-curricular packet that includes everything equine from United States horse history, breeds, grooming tools, and plenty of new vocabulary terms. Split into 11 lessons, learners complete crossword...
Baylor College
How Do We Use Water?
Send youngsters home to survey how they use water in their homes. Then bring them together to discuss which uses are essential for our health and which are not. A helpful video offers teaching tips for this lesson, and a presentation...
Pearson
End-of-Year Portfolio Guidelines
Go beyond a traditional end-of-the-year survey and have your middle school pupils compile a portfolio of work illustrating their progression as a writer.
Math Worksheets Land
Pie or Circle Graphs—Step-by-Step Lesson
How do you display data that you've collected in a pie chart? Follow a clear step-by-step guide to turning survey results into a visible format. It shows kids how to determine the percentage of the whole that each section represents.
Virginia Department of Education
May I Have Fries with That?
Not all pie graphs are about pies. The class conducts a survey on favorite fast food categories in a lesson plan on data representation. Pupils use the results to create a circle graph.
Delaware Coalition Against Domestic Violence
Healthy Relationships
Teach tweens and teens how to prevent dating and domestic violence with a unit on healthy relationships. The unit begins with class members taking a relationships survey. As the unit progresses, class members engage in activities that...
Curated OER
Water Survey
Students investigate water usage for the average home with the help of conducting a home survey. The information is collected and organized into a graphic format. Then they analyze the results to formulate an educated opinion about water...
Curated OER
Create a Graph Online
Scholars create colorful bar, line, or pie graphs. They decide on a survey question to ask or a type of data to gather. From there, they collect information and data. They display this data in bar, line, or pie graphs that they create...
Student Handouts
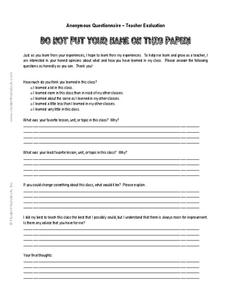
Teacher Evaluation Sheet
As you approach the end of the school year, ask your class members to complete this anonymous questionnaire to gain insight into the strengths of your teaching, as well as areas that you can improve for next year!
DiscoverE
LIDAR: Mapping with Lasers
We would be lost without maps! How are they made? Introduce junior topographers to LIDAR technology with a fascinating activity. Set up a mock city, then have learners operate a laser measure to determine the shape of the landscape using...
Curated OER
Harry Potter Research Project
Students work together to complete a research project on Harry Potter. They write a research question and develop a survey to give to their classmates. Using the results, they create a graph and draw conclusions about the data collected.
Curated OER
Introduction of the "We the People..." Project and Volunteer Survey
Students complete a survey about their role in volunteering. They research opportunities to volunteer in their community. They identify ways in which the community would be different if no one volunteered.
Curated OER
Language Arts: Lewin Project
Fourth graders read and respond to the poem, "When I Am Angry." They complete surveys by analyzing the most common feeling and draw a bar graph of their behavior, using different colors to identify the duration of various feelings. ...
Smithsonian Institution
Picturing George: A Pictorial Survey of the Life of George Washington
Students create pictorial biographies of George Washington. Working in groups, they research various portions of Washington's life, highlighting significant events. After presenting their projects to the class, they are displayed for...
Curated OER
How Many of Each Coin Do We Have in Our Bag?-- Class Bar Graph
In this math worksheet, students participate in a group project to record the kind of coins they pick at random from a bag. Students record the data on this classroom bar graph.


