EngageNY
End-of-Module Assessment Task: Grade 7 Mathematics Module 5
Show learners how to use simulations and random sampling to reach conclusions with the last resource in a 25-part series. The assessment contains three scenarios, each with several parts, and covers comparing populations using random...
Statistics Education Web
Did I Trap the Median?
One of the key questions in statistics is whether the results are good enough. Use an activity to help pupils understand the importance of sample size and the effect it has on variability. Groups collect their own sample data and compare...
Willow Tree
Data Sampling
Some say that you can make statistics say whatever you want. It is important for learners to recognize these biases. Pupils learn about sample bias and the different types of samples.
American Statistical Association
Bubble Trouble!
Which fluids make the best bubbles? Pupils experiment with multiple fluids to determine which allows for the largest bubbles before popping. They gather data, analyze it in multiple ways, and answer analysis questions proving they...
CCSS Math Activities
Smarter Balanced Sample Items: 7th Grade Math – Target G
Don't leave learning to chance! Assess your class's understanding of random sampling and making inferences using questions from the experts at Smarter Balanced. As the seventh of nine parts in the Gr. 7 Claim 1 Item Slide Shows series,...
Education Development Center
Choosing Samples
What makes a good sample? Your classes collaborate to answer this question through a task involving areas of rectangles. Given a set of 100 rectangles, they sample a set of five rectangles to estimate the average area of the figures. The...
Illustrative Mathematics
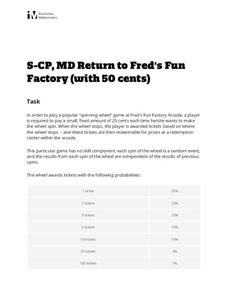
Return to Fred's Fun Factory (with 50 Cents)
The penny arcade gets the statistics treatment in this fun probability investigation. A non-standard game of chance is described and then the class is set loose to find missing probabilities, determine common outcomes, and evaluate...
Bowland
Public Transport
"Statistics is the grammar of science" -Karl Pearson. In the assessment task, learners read a claim made by a newspaper and analyze its conclusions. They need to think about the sample and the wording of the given statistics.
EngageNY
Margin of Error When Estimating a Population Proportion (part 2)
Error does not mean something went wrong! Learners complete a problem from beginning to end using concepts developed throughout the last five lessons. They begin with a set of data, determine a population proportion, analyze their result...
Curated OER
Randomness and Probability
In this statistics worksheet, 11th graders complete word problems by analyzing data given to them. They answer the probability of an even occurring and reasons it should occur. There are 16 questions on this worksheet.
Curated OER
Hypothesis Testing: Two Sample Tests
Students experiment and compare results of two populations. For this men and women populations lesson, students examine the difference in hand span for men and women. Students calculate a norm based on their results. Students complete...
Curated OER
Designing Samples/Simple Random Samples
High schoolers explore the concept of sampling techniques. In this sampling techniques lesson, students identify possible sources of bias in situations such as phone polls, supermarket surveys, and drawing names from a phone book. High...
Curated OER
A Statistical Study on the Letters of the Alphabet
Students see that there are mathematical rules that can affect our use of the English language. Calculate the probability of picking any letter at random from a piece of English literature.
Statistics Education Web
Who Sends the Most Text Messages?
The way you use statistics can tell different stories about the same set of data. Here, learners use sets of data to determine which person sends the most text messages. They use random sampling to collect their data and calculate a...
Curated OER
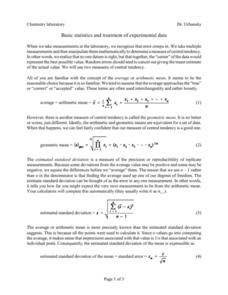
Basic Stats
In this chemistry worksheet, learners focus upon the concepts of mean and standard deviation and how it is used in the laboratory to interpret data.
Curated OER
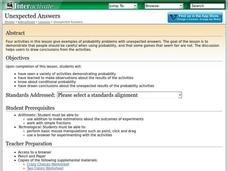
Unexpected Answers
High schoolers explore the concept of fairness. In this fairness lesson, students play four probability games. High schoolers determine who has the best chance of winning each of the four games. Students discuss which games gave an...
National Council of Teachers of Mathematics
Eruptions: Old Faithful Geyser
How long do we have to wait? Given several days of times between eruptions of Old Faithful, learners create a graphical representation for two days. Groups combine their data to determine an appropriate wait time between eruptions.
Curated OER
Ideas that Lead to Probability
Learners explore the concept of probability. In this probability lesson, students use random number generators to determine probabilities of events. Learners discuss if certain probable events are fair. Students determine fair ways to...
Shodor Education Foundation
From Probability to Combinatorics and Number Theory
What middle schooler does not enjoy an occasional online game? In this lesson play, you will find embedded links to an online probability game, and informative pages about how division is used in probability, the concept of tree models,...
Curated OER
Quiz: Mutually Exclusive Events, Independent Events, and Complement of an Event
In this statistics activity, students tell the relationship of two events. Students find the complement of given events. They compute the probability of a given event occurring.
Curated OER
Probability Distributions
Pupils collect and plot data on a graph. In this statistics lesson, students analyze the distribution of a sample and predict the outcome. They find the line of best fit and discuss what would make the sample larger.
Curated OER
Gender Issues through Chi-square Experiments
Students investigate teachers and gender preference. In this statistic lesson, students collect data of teachers calling on students to see if they are calling on one gender more than the other. Students examine the data and draw...
Curated OER
Confidence Levels
Students collect data and graph it. In this statistics activity, students rate confidence levels by collecting data and analyzing it. They graph their findings on the Ti calculator.
Curated OER
Why NP Min?
Students calculate the normal distribution. In this statistics lesson, students use the normal distribution to estimate binomial distributions. They define when to use NP and n(1-p) to make approximations.


