Shmoop
Box, Stem-Leaf, and Histogram
A helpful and versatile instructional activity requires young mathematicians to analyze data in order to create graphs and answer questions. Additionally, it prompts learners to find the mean, median, mode, and range of some of the data...
Virginia Department of Education
Exploring Statistics
Collect and analyze data to find out something interesting about classmates. Groups devise a statistical question and collect data from their group members. Individuals then create a display of their data and calculate descriptive...
Curated OER
Investigating Median, Mode, and Mean
Learners develop strategies to organize data while following teacher demonstration. They calculate the mean, median and mode of a data set while determining the relationships between the numbers. They analyze data from tables and double...
Curriculum Corner
Measures of Central Tendency
Reinforce the concept of central tendency—mean, median, mode, and range—with a practice packet that comprises of eight problems and a structured answer sheet with plenty of room to show work.
CK-12 Foundation
Displaying Univariate Data: Ordering Leaves
Leaf a little time to organize data. Given data displayed in a stem-and-leaf plot, learners organize the data in a list. Pupils use the data to determine the mode, median, and range of the data set. They determine the benefits of using a...
Curated OER
Maps and Modes, Finding a Mean Home on the Range
Fifth graders investigate data from maps to solve problems. In this data lesson, 5th graders study maps and collect data from each map. Students present their data in a variety of ways and calculate the mode, mean, median, and range.
Centre for Innovation in Mathematics Teaching
Ten Data Analysis Activities
This thirteen page data analysis worksheet contains a number of interesting problems regarding statistics. The activities cover the concepts of average measurements, standard deviation, box and whisker plots, quartiles, frequency...
Curated OER
Survey: What Shape Has More In the Lucky Charms Box?
In this Lucky Charms instructional activity, students identify the shapes in the box, and using tally marks, count how many of each shape are included. This instructional activity may be used in elementary grades, for counting and tally...
Curated OER
Collect, organize and compare different data for the Marine Mammals of the Miami Seaquarium, i.e.: size, weight, diet and habitat and how to calculate average, median, mode and range.
Learners collect, organize, and compare different data and develop statistical methods such as: average, median, mode and range as a way for decision making by constructing table
Curated OER
Dynamic Data Range, Mode, and Median
Students practice statistics skills by calculating range, mode, and median. In this 4th - 6th grade lesson plan, students calculate range, median, and mode of given numbers while playing a game.
American Statistical Association
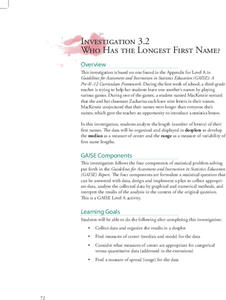
Who Has the Longest First Name?
Name that statistic! Classmates each write their name and the number of letters in it on a sticky note to place on the board. As a class, they determine the median, mode, and range of the name lengths, and create a dot plot of the data....
Curated OER
Determining Mean, Range, Median, Mode, and Probability
Students calculate mean, median, range, mode and probability. Then, working in teams, they use data from their workplace to compute values for these terms. Finally the class explores the term "probability" using a die.
Curated OER
Mean, Median, Mode and Range
Mean, median, mode, and range lessons can link math to real life experiences.
Curated OER
Exercise Those Statistics!
Students participate in various activities, measuring their pulse rates and recording the data. They analyze the statistical concepts of mean, median, mode, and histograms using the data from the cardiovascular activities.
Curated OER
Family Size
In this family size activity, students complete a tally chart to determine data from a family size line plot. They organize the data in the chart to determine the mean, median, mode, and range of the data. There are six problems in...
Curated OER
Probability and Statistics
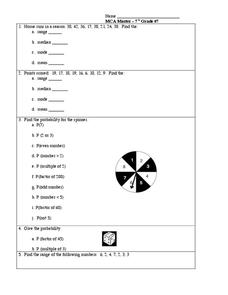
In this probability and statistics worksheet, learners complete 5 problems regarding range, mean, median, mode, and a spinner probability problem.
Curated OER
Statistics
In this statistics worksheet, 8th graders solve 4 problem sets related to an introduction to statistics. First, they find the range of each set of data. Then, students find the median and mode of each set of data. In addition, they...
Noyce Foundation
Baseball Players
Baseball is all about statistics. Pupils solve problems related to mean, median, and range. They calculate the total weight of players given the mean weight, calculate the mean weight of reserve players given the mean weight of the...
Curated OER
Measures of Central Tendencies: Quartiles
In this statistics activity, learners calculate the mean, median, mode, range, lower quartile, and upper quartile for 10 questions and interpret a box and whiskers graph.
Pace University
Grades 7-8 Mean, Median, and Mode
Take a central look at data. The differentiated lesson provides activities for pupils to calculate central tendencies. Scholars begin choosing three central tendency activities from a Tic-Tac-Toe board. Learners then choose from sports,...
CK-12 Foundation
Understand and Create Histograms: Histograms
Determine the shape of weight. Using the interactive, class members build a histogram displaying weight ranges collected in a P.E. class. Scholars describe the shape of the histogram and determine which measure of central tendency to use...
Curated OER
Mean, Median, and Mode 1
In this mean, median and mode worksheet, students use the measures of central tendency to describe given statistical data. Students identify the range of data, and match data to its representative bar graph. Two multi-step problems are...
Curated OER
Box Plots
Young scholars review the concept of median, explore how to calculate quartiles for any size data set and experience how to build a box plot.
Curated OER
Lesson #46: Bar Graphs and Line Graphs
In this bar graphs and line graphs worksheet, students interpret bar graphs, line graphs, and box-and-whisker plots. They find the measures of central tendency. This three-page worksheet contains notes, vocabulary, and approximately 10...


