Curated OER
Descriptive Statistics
Learners demonstrate how to use frequency and scatter diagrams. In this statistics lesson, students are introduced to different techniques of representing data. Learners sort and graph data on a worksheet and use a frequency diagram to...
Curated OER
1-4 Study Guide Integration: Statistics Stem-and-Leaf Plots
In this statistical worksheet, students organize given data into a stem-and-leaf plot. They then use their organize data to answer given questions. Students create two stem-and-leaf plots and answer five questions. An answer sheet is...
Curated OER
Football Statistics
In this math learning exercise, learners examine the statistical information as provided in the graphic organizer and calculate the other values.
Curated OER
Statistics and the Truth
In this math instructional activity, students solve a word problem related to illegal use of a firearm arrests in Hemlock County. Students read two candidates' statements and decide which is mathematically correct.
Curated OER
Unit 8 - Statistical Diagrams
In this statistical diagrams instructional activity, students solve 30 short answer problems. Students find the mean of a set of numbers and read/interpret a graph to answer questions. Students determine the x-values that satisfy a...
Curated OER
Analyze and Interpret Statistical Information
In this probability and statistics worksheet, 9th graders analyze and interpret histograms as they identify trends in the data. The two page worksheet contains four problems. Answers are provided.
Statistics Education Web
I Always Feel Like Somebody's Watching Me
Future statisticians and potential psychics first conduct an experiment to collect data on whether a person can tell if someone is staring at them. Statistical methods, such as hypothesis testing, chi-square tests, binomial tests, and...
Statistics Education Web
Who Sends the Most Text Messages?
The way you use statistics can tell different stories about the same set of data. Here, learners use sets of data to determine which person sends the most text messages. They use random sampling to collect their data and calculate a...
Curated OER
Starting With Stats
Statisticians analyze a data set of student IQs by finding measures of central tendency and dispersion such as mean, median, mode, and quartiles. They practice using a graphing calculator to find the values and analyze box plots and...
Curated OER
Unexpected Answers
Young scholars explore the concept of fairness. In this fairness lesson, students play four probability games. Young scholars determine who has the best chance of winning each of the four games. Students discuss which games gave an...
Georgia Department of Education
Math Class
Young analysts use real (provided) data from a class's test scores to practice using statistical tools. Not only do learners calculate measures of center and spread (including mean, median, deviation, and IQ range), but...
EngageNY
Linear Models
Expand your pupils' vocabulary! Learn how to use statistical vocabulary regarding linear models. The lesson teaches scholars the appropriate terminology for bivariate data analysis. To complete the module, individuals use linear...
Curated OER
Sampling Bias And the California Recall
Using a 2002 California Gray David recall vote as an example, young statisticians identify sources of bias in samples and find ways of reducing and eliminating sampling bias. They consider ways to select random samples from a...
Curated OER
Basic Stats
In this chemistry worksheet, students focus upon the concepts of mean and standard deviation and how it is used in the laboratory to interpret data.
K20 LEARN
Do Placebos Kill Minotaurs?
But it's just a game! Learners play a game to learn basic concepts of statistical hypothesis testing. After using the digital-game module, pupils develop their own statistical hypotheses and test them.
College Board
2018 AP® Statistics Free-Response Questions
Are your classes ready for their final exams? Give them a test run with the 2018 AP® exam. The resource provides the six free-response questions covering topics such as confidence intervals, population proportions, and least-squares...
College Board
2017 AP® Statistics Free-Response Questions
Reduce testing anxiety by helping learners prepare for test day. Scholars complete six free-response questions from a released AP® exam. The questions test a variety of concepts including confidence intervals, frequency tables,...
Curated OER
Pi Day: The Other Math Holiday!
Happy Pi Day! This collection of games, experiments, and activities leads participants through an exploration of the many aspects and attributes of that mysterious quantity, pi. Activities range from using statistical...
Laying the Foundation
Box-and-Whisker Plots
Statistics is made approachable, and dare we say fun, in this activity on using box-and-whisker plots to analyze and compare data sets. Specific emphasis is placed on interpretations and explanations while graphing, and in using the...
EngageNY
Describing Distributions Using the Mean and MAD
What city has the most consistent temperatures? Pupils use the mean and mean absolute deviation to describe various data sets including the average temperature in several cities. The 10th instructional activity in the 22-part series asks...
International Technology Education Association
Team Up on the Weather
There's a little bit about every aspect of weather in this trivia game. The lesson resource provides 36 questions and answers pertaining to four different topics related to weather: effects, science, technology, and statistics. Groups...
American Statistical Association
Candy Judging
Determine the class favorite. The statistics lesson plan has pupils collect, display, and analyze data. Pairs rank four kinds of candy based on their individual preferences. Working as an entire class, learners determine a way to display...
Illustrative Mathematics
Return to Fred's Fun Factory (with 50 Cents)
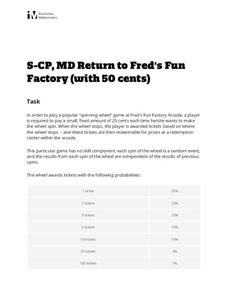
The penny arcade gets the statistics treatment in this fun probability investigation. A non-standard game of chance is described and then the class is set loose to find missing probabilities, determine common outcomes, and evaluate...
Radford University
A Change in the Weather
Explore the power of mathematics through this two-week statistics unit. Pupils learn about several climate-related issues and complete surveys that communicate their perceptions. They graph both univariate and bivariate data and use...
Other popular searches
- Data, Census, & Statistics
- Probability and Statistics
- Educational Statistics
- Baseball Statistics
- Math Statistics
- Climate Statistics
- Math Lessons Statistics
- Median and Mean Statistics
- Statistics Lesson Plans
- Sports and Statistics
- Probability Statistics
- Black Plague Statistics


