EngageNY
End-of-Module Assessment Task - Algebra 1 (Module 2)
Check for understanding at the end of your descriptive statistics unit with an end-of-module assessment. It uses five questions to measure progress toward mastery of descriptive statistics standards. Each question is developed to address...
EngageNY
Describing the Center of a Distribution
So the mean is not always the best center? By working through this exploratory activity, the class comes to realize that depending upon the shape of a distribution, different centers should be chosen. Learners continue to explore the...
EngageNY
Estimating Centers and Interpreting the Mean as a Balance Point
How do you balance a set of data? Using a ruler and some coins, learners determine whether the balance point is always in the middle. Through class and small group discussions, they find that the mean is the the best estimate of the...
Statistics Education Web
Now You SeeIt, Now You Don't: Using SeeIt to Compare Stacked Dotplots to Boxplots
How does your data stack up? A hands-on activity asks pupils to collect a set of data by measuring their right-hand reach. Your classes then analyze their data using a free online software program and make conclusions as to the...
Curated OER
Points, Lines, Planes, and Space
In this points, lines, planes, and space worksheet, students solve word problems dealing with points, lines, planes, and space. Students complete 20 individual problems and 20 group problems.
Curated OER
The Power of Graphical Display: How to Use Graphs to Justify a Position, Prove a Point, or Mislead the Viewer
Analyze different types of graphs with learners. They conduct a survey and determine the mean, median and mode. They then identify different techniques for collecting data.
Illustrative Mathematics
Puzzle Times
Give your mathematicians this set of data and have them create a dot plot, then find mean and median. They are asked to question the values of the mean and median and decide why they are not equal. Have learners write their answers or...
EngageNY
Normal Distributions (part 1)
Don't allow your pupils to become outliers! As learners examine normal distributions by calculating z-scores, they compare outcomes by analyzing the z-scores for each.
EngageNY
Describing Center, Variability, and Shape of a Data Distribution from a Graphical Representation
What is the typical length of a yellow perch? Pupils analyze a histogram of lengths for a sample of yellow perch from the Great Lakes. They determine which measures of center and variability are best to use based upon the shape of the...
College Board
Is That an Assumption or a Condition?
Don't assume your pupils understand assumptions. A teacher resource provides valuable information on inferences, assumptions, and conditions, and how scholars tend to overlook these aspects. It focuses on regression analysis, statistical...
College Board
So Much Data, So Little Time
Organizing data in a statistics class is often a challenge. A veteran statistics teacher shares data organization tips in a lesson resource. The instructor shows how to group data to link to individual calculators in a more efficient...
Illustrative Mathematics
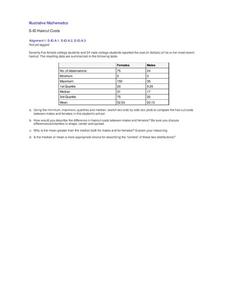
Haircut Costs
Who pays more for haircuts, men or women? Given quartile values, learners construct box and whiskers plots and interpret the results. They compare the mean and median, and discuss which is more appropriate under particular conditions....
Georgia Department of Education
The Basketball Star
Have learners use math to prove they are sports stars! Assess a pupil's ability to create and analyze data using a variety of graphs. The class will be motivated by the association of math and basketball data.
Curated OER
China's Population Growth
Learners collect data from China's population growth and determine the mean, median, and mode from the data. For this data lesson plan, pupils determine probabilities and use them to make predictions.
Curated OER
Do You Have a Blog?
Ask learners about their personal writing habits, such as whether they keep a journal or a blog, or if they'd ever want to. Though this is not a fully developed instructional activity, you can use this article and question to provoke...
Illustrative Mathematics
Puppy Weights
Nobody can say no to puppies, so lets use them in math! Your learners will take puppy birth weights and organize them into different graphs. They can do a variety of different graphs and detail into the problem based on your classroom...
Curated OER
EOC Review G
In this end of course review, students factor expressions, interpret statistic problems, and identify the maximum and minimum of equations. This two-page worksheet contains 5 multi-step problems.
Texas Instruments
Points, Lines, and Planes
Students solve problems dealing with points, lines and planes. In this geometry instructional activity, students differentiate between parallel lines and planes. They find the intersection of lines and planes.
Curated OER
There's Gold in Them Thar Ratios
Students draw a model of the bunny problem which generates the Fibonacci Sequence, spirals generated from golden rectangles and golden triangles; identify the golden ratio in the human body, and find the Fibonacci numbers in nature.
Curated OER
Human Face of Mathematics - Mathematics in Aboriginal Culture
Students collect statistical data. In groups, students play a dart game and then determine the distance between darts. They collect the data and plot the information on a coordinate plane. They identify the mean and the standard...
Curated OER
Shape Up
Learners explore differents types of triangles and quadriaterals. In this polygon lesson, students model identify and compare two and three dimensional geometric figures. Learners create tangrams and discover the difference between...
Curated OER
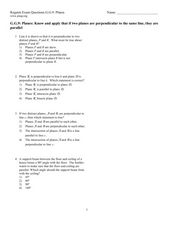
Regents Exam Questions G.G.9: Planes
In this planes learning exercise, high schoolers solve 3 short answer problems. Students determine a true statement given lines perpendicular to a plane.
Curated OER
Circles Terminology Multiple Choice
In this circles worksheet, students solve 10 multiple choice problems. Students answer questions about diameter and chord relationships, tangent lines to a circle, circumference, the Pi relationship, etc.
Curated OER
Worksheet 5
In this math instructional activity, students describe how to define surface area given a variety of situations from word problems. They solve for the volume using calculus.
Other popular searches
- Skew Lines
- Parallel Skew Lines
- Dispersion and Skewness
- Skew and Parallel Lines
- Geometry Skew Lines
- Skewed Statistics
- Skew Rays
- Skewer
- Angle Skew


