Curated OER
Lines of Fit
Students analyze graphs. In this algebra lesson, students find the line of best fit, using scatter plots. They calculate the sale of popcorn as it relates to the price. They then analyze the graphs for positive, negative and no correlation.
Curated OER
Linear Inequalities
Learners solve linear inequalities. For this solving linear inequalities lesson, students solve one step inequalities algebraically. Learners graph the solutions on a number line. Students compare the graphs of various inequalities such...
Curated OER
Analysis Review Sheet
In this analysis review worksheet, students solve 3 complex inequalities, graph 2 absolute value inequalities, and write the equations for altitudes and tangent lines for 4 problems.
Curated OER
Measuring & Graphing Motion
Fifth graders study how to measure distance. In this graphing motion lesson students complete a lab activity that shows them on the computer how to make graphs.
Curated OER
Real Life Graphs
In this real life graphs learning exercise, students examine graphs and determine the equation of a line. They interpret distance time graphs and draw graphs to match a real life situations. This three-page learning exercise contains 3...
EngageNY
Geometric Interpretations of the Solutions of a Linear System
An intersection is more than just the point where lines intersect; explain this and the meaning of the intersection to your class. The 26th segment in a 33-part series uses graphing to solve systems of equations. Pupils graph linear...
EngageNY
Increasing and Decreasing Functions 2
Explore linear and nonlinear models to help your class build their function skills. In a continuation of the previous lesson, learners continue to analyze and sketch functions that model real-world situations. They progress from linear...
Curated OER
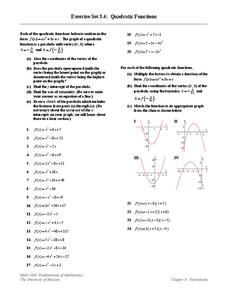
Quadratic Functions
In this graphing quadratic equations worksheet, students find the vertex and graph the parabola for 24 quadratic equations. The final four are factored into binomials to increase accuracy of the x intercepts.
Concord Consortium
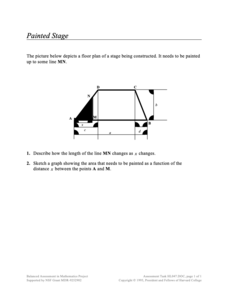
Painted Stage
Find the area as it slides. Pupils derive an equation to find the painted area of a section of a trapezoidal-shaped stage The section depends upon the sliding distance the edge of the painted section is from a vertex of the trapezoid....
Kenan Fellows
Man vs. Beast: Approximating Derivatives using Human and Animal Movement
What does dropping a ball look like as a graph? An engaging activity asks learners to record a video of dropping a ball and uploading the video to software for analysis. They compare the position of the ball to time and calculate the...
Curated OER
Worksheet 14
In this math worksheet, students analyze a path around a circle. The interval is defined. Students sketch a graph of a given parametric curve. Five application problems give students practice using these concepts in real life situations.
Curated OER
Math Lesson: What Do You Want to Know? - Country Statistics
Young scholars are able to identify the characteristics of a variety of graphs (i.e. bar graph, line graph, pie graph, scatter plot, population pyramids, etc.) They recognize how the type of data to be presented plays a role in choosing...
Curated OER
Graphing Functions
In this graphing functions worksheet, students solve and complete 13 different problems that include identifying and graphing various functions. First, they graph each of the functions shown on the graphs provided. Then, students solve...
Curated OER
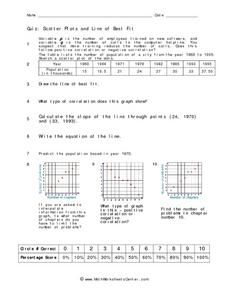
Quiz: Scatter Plots and Line of Best Fit
In this scatter plots and line of best fit activity, students create scatter plots from given sets of data. They answer questions concerning the scatter plot. Students write the equation of a line, identify the type of correlation...
EngageNY
End-of-Module Assessment Task - Algebra 2 (Module 1)
A series of assessment tasks require learners to process information and communicate solutions. Topics include graphing parabolas, solving linear-quadratic systems, factoring polynomials, and solving polynomial equations.
Curated OER
Position and Velocity vs. Time Graphs
For this position and velocity worksheet, students sketch graphs of position vs. velocity and position vs. time for 6 problems given different scenarios. They label their graphs with given positions, velocities and times.
Curated OER
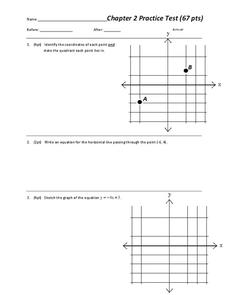
Chapter 2 Practice test
Overall, this worksheet contains a good selection of problems that reviews different aspects of linear equations. Learners examine and graph linear equations, absolute value equations, and inequalities in two variables. The three page...
Curated OER
Worksheet 11 - Points of Discontinuity
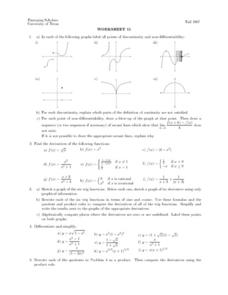
In this points of discontinuity worksheet, students observe graphs and label them as points of discontinuity and non-differentiability. They identify the derivatives of functions. This one-page worksheet contains five multi-step problems.
Curated OER
"Graph It"
Students work in teams to conduct short surveys of their classmates. They show their results using at least two different types of graphs.
Students separate into teams and are asked that each team to choose something that they are...
Curated OER
Weathering Lab
Assist your middle school class with one of the most inclusive weathering and erosion labs available. Individuals use sugar cubes and alka-seltzer to demonstrate the process of physical and chemical weathering. They sketch results...
Bytes Arithmetic
Geometry Pad+
Graphing paper, pencil, ruler, protractor, and compass, all get replaced or supplemented with this dynamic geometry application. Here, you can create, move, and scale many different shapes, as well as, explore and change their properties...
Curated OER
CCC: Credible sources, Creative Commons Images, and Citing Your Sources
As part of a unit devoted to the study of autobiographies, this one-day library session focuses on developing research skills. Class members locate and properly cite a sketch of a Creative Commons image, as well as record the call...
Curated OER
Graphing Linear Inequalities
In this algebra worksheet, students graph inequality linear graphs and shade using a test point. There are 14 problems with an answer key.
Balanced Assessment
Getting Closer
Flip the script! Reverse the situation and ask the class to find the function given asymptotes. The task requires class members to use their knowledge of functions and asymptotes to create functions that have a given asymptote or...


