EngageNY
Horizontal and Vertical Asymptotes of Graphs of Rational Functions
Get close to your favorite line. Scholars use end behavior to help find horizontal asymptotes. With the understanding of domains of rational functions, learners find vertical asymptotes and then use graphing calculators to verify the...
Curated OER
Introduction to Tangent Lines using the TI-Nspire
Students make mathematical argument using the concept of Limit. In this algebra lesson, student calculate the instantaneous rate of change from the linear graph. They use a TI-calculator to create a visual of the graphs.
Curated OER
Lines in the Plane
Learners differentiate between parallel and perpendicular lines. In this algebra lesson, students graph linear equations using the slope intercept form. They classify lines based on their slopes.
Utah Education Network (UEN)
Finding Slope of a Line from Graphs, Tables, and Ordered Pairs
Middle schoolers explore the concept of slope in numerous ways and start to look at simple linear equations. They describe the slope in a variety of ways such as the steepness of a line, developing a ratio, using graphs, using similar...
Curated OER
Worksheet 10 - Limits
In this limits worksheets, students graph tangent lines and determine the slope of a secant line. This one-page worksheet contains six multi-step problems.
Curated OER
Graphing Lines
In this graphing lines learning exercise, students graph lines that are in the point-slope form. They identify the y-intercept and the slope. They graph the equation of a line on a coordinate plane. This four-page learning exercise...
Curated OER
Slopes of Lines
In this slopes of lines instructional activity, 10th graders solve and graph 10 different problems. First, they determine the slope of each line named in the figure and any line parallel to line b and perpendicular to line d. Then,...
Concord Consortium
Line of Sight
There's no way around it—learners must use trigonometry to model the line of sight around a race track! Using the starting line as the origin, pupils model the straight line distance to any car using a trigonometric expression. The...
Curated OER
Call it "Macaroni"
Who knew there were so many fun educational opportunities featuring pasta? Scholars read a brief informational text about the history of pasta (note that "macaroni" is spelled two different ways, so address this if kids are reading...
Curated OER
Using Graphs
In this using graphs worksheet, 9th graders solve and complete 6 different types of problems. First, they determine how the transformation shown moves the graph. Then, students find the interval that is defined given the coordinates....
Illustrative Mathematics
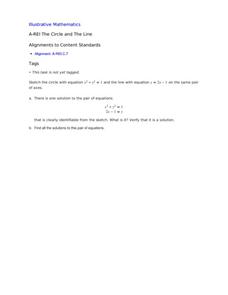
The Circle and The Line
Here is a resource where algebra learners show their understanding of a system of equations involving a circle and a line. Once graphed, learners see two points of intersection, one where the ordered pair is read, and a second where...
Concord Consortium
Shooting Arrows through a Hoop
The slope makes a difference. Given an equation of a circle and point, scholars determine the relationship of the slope of a line through the point and the number of intersections with the circle. After graphing the relationship, pupils...
EngageNY
Modeling Linear Relationships
Math modeling is made easy with the first installment of a 16-part module that teaches pupils to model real-world situations as linear relationships. They create graphs, tables of values, and equations given verbal descriptions.
Utah Education Network (UEN)
Linear Graphs Using Proportions and Rates
Using a TI-73 or other similar graphing calculator middle school math majors investigate the linear relationship of equivalent proportions. After a brief introduction by the teacher, class members participate in a timed pair share...
Illustrative Mathematics
Latitude
The greater the latitude, the less of the Earth is north. Scholars graph the relationship between the latitude and the percentage of the Earth that is north of the latitude. Using the graph and the table, class members interpret values...
Curated OER
Graphing
In this graphing worksheet, students sketch graphs of given polynomial equations. They draw line graphs to show sign changes in specified forms. This one-page worksheet contains ten problems. Answers are provided at the bottom of the...
EngageNY
Systems of Equations
What do you get when you cross a circle and a line? One, two, or maybe no solutions! Teach learners to find solutions of quadratic and linear systems. Connect the visual representation of the graph to the abstract algebraic methods.
Inside Mathematics
Sorting Functions
Graph A goes with equation C, but table B. The short assessment task requires class members to match graphs with their corresponding tables, equations, and verbalized rules. Pupils then provide explanations on the process they used to...
Curated OER
Ordering Integers
Sixth and seventh graders compare and order integers. After locating integers in a newspaper, they describe examples of negative and positive integers. They draw a thermometer and locate positive and negative integers on the scale. In...
Curated OER
Graphing Scatterplots
Students examine scatterplots and determine the equation of a line using the slope-intercept method. Students interpret graphs, draw inferences, and sketch a curve of best fit for the graph. Based upon patterns in the graphs, students...
Curated OER
Graphing lines in Standard Form
In this algebra worksheet, students graph lines on a coordinate plane after rewriting the equations in the form y= mx + b. There are 12 graphing problems with an answer key.
Curated OER
Graphing Lines
In this algebra worksheet, 9th graders are given a linear equation and asked to graph the lines. There are 12 questions with an answer key.
Virginia Department of Education
Transformation Investigation
Graph it! Investigate transformations with a graphing calculator. Pupils graph sets of linear functions on the same set of axes. They determine how changes in the equation of a linear function result in changes in the graph.
Curated OER
Further Differentiation
In this further differentiation worksheet, students solve and complete 7 various types of problems. First, they sketch the graph of each equation using a stationary point. Then, students find the stationary points of each and describe...


