Shodor Education Foundation
Scatter Plot
What is the relationship between two variables? Groups work together to gather data on arm spans and height. Using the interactive, learners plot the bivariate data, labeling the axes and the graph. The resource allows scholars to create...
Shodor Education Foundation
Incline
Study velocity while examining graphical representations. As scholars work with the animation, they discover the effect the height of an incline has on the velocity of the biker. They make conclusions about the slope of the...
Learning Games Lab
Scientific Graph Reading
Interpreting graphs is an essential skill for young scientists. An interactive online lesson gives individuals an opportunity to review the components of a graph and learn to read and interpret the shape of a graph. The lesson includes...
Learning Games Lab
The Magic of Reading Graphs
Making conclusions from graphs doesn't need to seem like magic. Learners explore an interactive lesson on reading graphs to strengthen their skills. The content discusses how to read the axes of a graph and draw conclusions based on the...
Physics Classroom
Case Studies: Impulse and Force
Why are gym walls padded and cars required to have air bags? Scholars observe two similar situations, such as those listed above, with only one variable altered. They identify the different variable and determine how the variation...
CK-12 Foundation
Electric Ice Sheet
Tommy is trapped on an ice bridge and needs you to balance the charges so he doesn't fall into the icy water! Scholars apply Coulomb's Law, which relates to both the strength and the distance between charges. They work with these two...
Physics Classroom
Using Graphs
Many university professors complain incoming scholars struggle with interpreting graphs. A skill builder offers three different types of exercises including calculating slope, interpreting graphs, and extrapolating outside the plotted...
Shodor Education Foundation
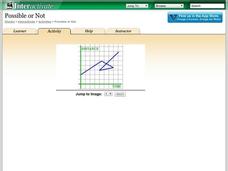
Possible or Not?
What does the graph mean? Pupils view 10 graphs and determine whether they are possible based on their contexts. The contexts are distance versus time and profit versus time.
Curated OER
Using the Scientific Method
In this scientific method worksheet, students click on the links in the questions about the scientific method to find the answers to the questions and then come back and answer the questions. Students answer 12 questions total.
Curated OER
Border Collie Bonanza
In this online quiz worksheet, students answer a set of questions about the Border Collie. Answers may be submitted for review by clicking a link at the bottom of the page.
Shodor Education Foundation
Multiple Linear Regression
You'll have no regrets when you use the perfect lesson to teach regression! An interactive resource has individuals manipulate the slope and y-intercept of a line to match a set of data. Learners practice data sets with both positive and...


