Curated OER
Canada at a Glance
Stjudents examine the statistics in a Canadian publication for use in graphs. They develop their own questions based on tables and graphs found in this publication..
Curated OER
Interpreting and Displaying Sets of Data
Students explore the concept of interpreting data. In this interpreting data lesson, students make a line plot of themselves according to the number of cubes they can hold in their hand. Students create their own data to graph and...
Curated OER
Big Boats Up The River
Using boats along in the Port of Albany as the focus, learners practice adding single-digit numbers and interpreting data. This lesson comes with the worksheets, resource links, and other materials to make it a worthwhile experience.
Teach Engineering
Building-Testing-Improving Paper Airplanes: Head's Up!
Take foldables to all new heights. Pupils build and fly different types of paper airplanes in the 14th portion of a 22-part unit on aviation. Groups collect data on distance and flight time for each plane and compare the data from the...
Balanced Assessment
Solar Elements
Let your brilliance shine like the sun. Future mathematicians and scientists consider given data on the abundance of different elements in the sun. The assessment task requires consideration of how these different abundances relate to...
Alabama Learning Exchange
I Know What You Did Last Summer: A Data Graphing Project
Young scholars participate in graphing data. In this graphing data instructional activity, students make a stem and leaf plot of their summer activities. Young scholars create numerous graphs on poster boards. Students discuss the...
National Museum of Nuclear Science & History
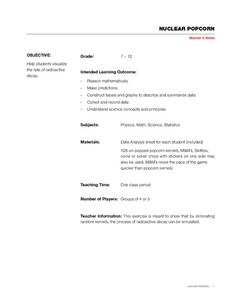
Nuclear Popcorn
Make your lesson on radioactive decay pop with this lab exercise. Using popcorn kernels spread over a tabletop, participants pick up all of those that point toward the back of the room, that is, those that represent decayed atoms. As the...
Curated OER
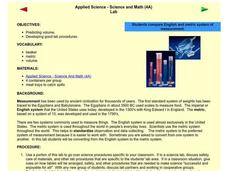
Applied Science - Science and Math Lab
Although it was written to use in a science class, this measurement lesson is adaptable to Common Core standards in math for measurement and data. Youngsters are introduced to two types of measurement systems. They use both the English...
Curated OER
Energy Conservation
Students investigate energy conservation. In this energy conservation and analyzing data lesson, students identify and explain several energy sources and research renewable and nonrenewable energy sources. Students use statistics form...
Curated OER
What Can I Afford?
Students explore the concept of cell phone plans. In this cell phone plan lesson, students research the cost of cell phones. Students compare various cell phone plans and decide on which phone plan is best for them.
Curated OER
Learning to Make Line Graphs
Students analyze data and create a line graph. In this graphing lesson, students explore data from a previous experiment and plot the information on a line graph. Students analyze their findings.
Agriculture in the Classroom
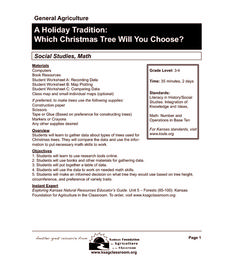
A Holiday Tradition: Which Christmas Tree Will You Choose?
Different varieties of Christmas trees provide an interesting way to combine social studies, science, math, and technology. Class members not only research the history of the Christmas tree holiday tradition, they compare and contrast...
Curated OER
Pizza Possibilities
Middle schoolers create and interpret line plots, bar graphs, and circle graphs. The lesson assumes mastery of conversions from fraction to decimal to percent, construction of angles, and at least an introduction to graphs displaying data.
Curated OER
Science and Technology
Students research inventions that have been created. In this historical technology instructional activity, students read the Harcourt Brace social studies textbook and discuss how inventors used graphs to display data. Students create a...
Curated OER
What's My Pattern?
Students recognize, describe and extend patterns in three activities. They organize data, find patterns and describe the rule for the pattern as well as use the graphing calculator to graph the data to make and test predictions. In the...
Alabama Learning Exchange
Keep It Movin'!
Learners conduct an experiment to study friction. They complete a KWL chart on friction and conduct an activity about the amount of friction on a moving object. To conclude, pupils create a table or graph of the data collected and they...
Curated OER
The Solar Cycle
Learners research the solar cycle. In this Science lesson, students use the internet to investigate the solar cycle. Learners produce a spreadsheet and graph from the information collected.
Curated OER
Biospheres in Your Backyard
Students collect data from a local river biome. They use the information for metric conversion and graphing equations. They study the components of what makes up a biosphere and how math is used to analyze one.
Bowland
Day Out
Use mathematics to help plan a field trip. Scholars use the results of a survey to determine where a class should go on a field trip. They use provided data about entrance fees and mileage to calculate the cost per person of such a trip.
Teach Engineering
Energy Perspectives
The data says ... the resource is great to use. Using Microsoft Excel, pupils analyze data from the US Department of Energy in the fifth lesson of a 25-part Energy Systems and Solutions unit. Each group looks at a different data set and...
Curated OER
First Class First? Using Data to Explore the Tragedy of the Titanic
Learners analyze and interpret data related to the crew and passengers of the Titanic. They research information on a Titanic database to illustrate specific statistical conclusions, and whether or not social status affected the outcome.
Curated OER
Nine Examples for Tables, Pictographs, Mean. Median, and Mode
In this graphical representation of data and measures of central tendency worksheet, students calculate mean, median, and mode and answer questions related to graphs, tables, and pictographs.
Curated OER
Sweethearts and Data Analysis
Middle schoolers explore the concept collecting and representing data. For this collecting and representing data lesson, students record the different colors of sweetheart candies in their sweethearts box. Middle schoolers create a table...
Curated OER
Using Current Data for Graphing Skills
Students graph demographic information. In this graphing lesson, students choose what type of graph to create and what information to display. Links to examples of graphs and statistical data are provided. The graphs are created on the...


