Raytheon
Scatter Plots
In this scatter plots worksheet, students complete multiple choice questions about scatter plots having to do with money, free throws, exercising, and more. Students complete 8 problems.
Inside Mathematics
Scatter Diagram
It is positive that how one performs on the first test relates to their performance on the second test. The three-question assessment has class members read and analyze a scatter plot of test scores. They must determine whether...
Curated OER
Linear Regression and Correlation
Learners explore scatter plots. In this linear regression lesson, groups of pupils graph scatter plots and then find the line of best fit. They identify outliers and explain the correlation. Each group summarizes and shares their...
Curated OER
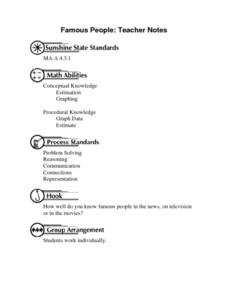
Famous People: Teacher Notes
Young statisticians practice creating scatter plots. First, they estimate the age of 14 people. Next, they write down the estimate in a table labeled x. Then write down their actual age in the table labeled y. Using these x and y...
Curated OER
Scatter Plot Basketball
Learners take turns shooting baskets and creating scatterplots based on the data. They create two graphs and look for possible correlation in the data for each graph.
Curated OER
Comparison of Univariate and Bivariate Data
Learners explore the concept of univariate and bivariate data. In this univaritate and bivariate data lesson, pupils discuss the differences between univariate and bivariate data. They work sample problems where they must construct box...
Curated OER
A Day at the Beach
Help learners determine the rate of change for the temperature of sand. They will collect data on the temperature of wet and dry sand over time with a heat lamp overhead. Then make a scatter plot of the data and find a linear model to...
EngageNY
Analyzing Residuals (Part 1)
Just how far off is the least squares line? Using a graphing calculator, individuals or pairs create residual plots in order to determine how well a best fit line models data. Three examples walk through the calculator procedure of...
Mathed Up!
Scatter Graphs
Make an estimate by getting in line. The class works with scatter plots and lines of best fit to make an estimate for given values. Pupils determine whether there is a positive or negative correlation and draw a best-fit line. Using the...
Curated OER
Hand Span and Height
Is there a relationship between hand span width and height? Statisticians survey each other by taking measurements of both. A table that can hold data for 24 individuals is printed onto the worksheet, along with questions for analysis....
Charleston School District
The Line of Best Fit
If it's warm, they will come! Learners find a line of best fit to show a relationship between temperature and beach visitors. Previous lessons in the series showed pupils how to create and find associations in scatter plots. Now, they...
EngageNY
Informally Fitting a Line
Discover how trend lines can be useful in understanding relationships between variables with a lesson that covers how to informally fit a trend line to model a relationship given in a scatter plot. Scholars use the trend line to make...
EngageNY
Relationships Between Two Numerical Variables
Working in small groups and in pairs, classmates build an understanding of what types of relationships can be used to model individual scatter plots. The nonlinear scatter plots in this instructional activity on relationships between two...
Virginia Department of Education
Scatterplots
Math is all fun and games with this activity! Learners use an activity designed around hula hoops to collect data. They create scatter plots with their data and then analyze the graphs for correlation.
Mathematics Assessment Project
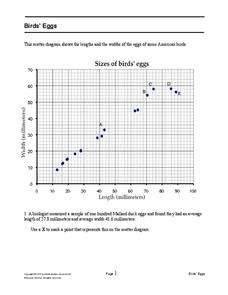
Bird’s Eggs
Are the length and width of birds' eggs related? Young ornathologists use a scatter plot to investigate the relationship between the length and width of eggs for Mallard ducks. They then determine the egg with the greatest...
Curated OER
Comparison of Two Different Gender Sports Teams - Part 3 of 3 Scatter Plots and Lines of Best Fit
Learners create a scatter plot for bivariate data and find the trend line to describe the correlation for the sports teams. In this scatter plot lesson, students analyze data, make predictions,and use observations about sports data...
Curated OER
Scatter Plots
In this scatter plots worksheet, students solve and complete 4 different problems. First, they use the table shown to model the relation with a scatter plot and trend line and to predict the value of a variable when given the other...
Curated OER
Scatter Plots
In this scatter plots worksheet, students solve and complete 6 different problems. First, they create a scatter plot to illustrate how weight and height are related and determine their relationship as positive, negative or no relation....
Curated OER
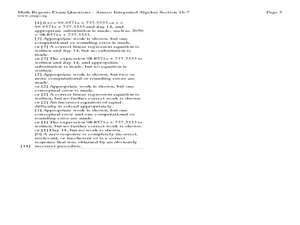
Fourteen Math Regent Exam Statistics Questions on Scatter Plots and Linear Regression
In this linear regression worksheet, learners solve fourteen Math Regent Exam questions regarding scatter plots and linear regression. The solutions are provided.
Balanced Assessment
Who's Left?
If you're not right-handed, are you wrong-handed? Young statisticians calculate the percentage of left-handed people using a given data set in the assessment task. They plot data on a scatter plot and consider how the line of best fit...
Curated OER
Perplexing Puzzles
Elementary and middle schoolers explore scatter plots. In this graphing lesson, pupils work in small groups and use jigsaw puzzles to develop a scatter plot. Younger learners may develop a bar graph.
Curated OER
The Way to Better Grades!
Pupils collect and analyze data. In this statistics lesson, learners create a scatter plot from their collected data. They use, tables and graphs to analyze the data and mae decisions.
American Statistical Association
EllipSeeIt: Visualizing Strength and Direction of Correlation
Seeing is believing. Given several bivariate data sets, learners make scatter plots using the online SeeIt program to visualize the correlation. To get a more complete picture of the topic, they research their own data set and perform an...
CK-12 Foundation
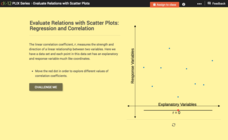
Evaluate Relations with Scatter Plots: Regression and Correlation
Introduce the concept of a correlation coefficient using an interactive lesson. Learners begin by manipulating a correlation coefficient and watching a graph change to represent the new value. Questions help strengthen their...
Other popular searches
- Scatterplots
- Scatterplots and Correlation
- Interpreting Scatterplots
- Create Scatterplots
- Algebra 2 Scatterplots
- Drawing Scatterplots
- Explaining Scatterplots
- Scatterplots Heart
- Pre Algebra Scatterplots
- "Algebra 2" Scatterplots
- Algebra 2" Scatterplots


