Radford University
Mathematical Modeling: Lessons 2-3
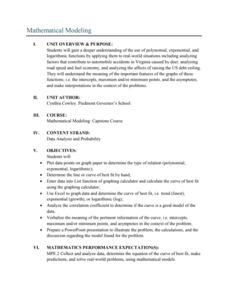
Not all functions are created equal. Pupils apply regression analysis using polynomial, exponential, and logarithmic functions to investigate the relationship between variables and to decide which function would be best to model the...
Radford University
Mathematical Modeling: Lesson 1
Will more deer result in more big game licenses? Scholars first research data on the number of deer and the number of big game licenses in Virginia between 1990 to 2009. They apply polynomial, exponential, and logarithmic regression to...
Mathematics Vision Project
Modeling Data
Is there a better way to display data to analyze it? Pupils represent data in a variety of ways using number lines, coordinate graphs, and tables. They determine that certain displays work with different types of data and use...
Intel
Track the Trends
Allow your classes to research what interests them. An engaging STEM lesson, the fourth in the series of six, asks individuals to choose a topic of interest and analyze the data through regression models. The regression equations allow...
Mathematics Vision Project
Module 9: Modeling Data
How many different ways can you model data? Scholars learn several in the final module in a series of nine. Learners model data with dot plots, box plots, histograms, and scatter plots. They also analyze the data based on the data...
Intel
What Does This Graph Tell You?
What can math say about natural phenomena? The fifth STEM lesson in this project-based learning series asks collaborative groups to choose a phenomenon of interest and design an experiment to simulate the phenomenon. After collecting...
Radford University
Down on Sue's Farm
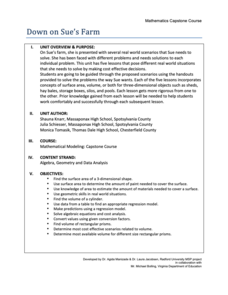
When would a farmer use math? Class members work through five tasks on a farm that require knowledge of surface area, volume, and determining regression equations. The challenges range from figuring out the amount of paint to buy,...
Radford University
Feeding the World
Using technology, pupils find an exponential function to model the population growth of the US. With more information, learners derive the population growth formula for the world. Ultimately, they determine the amount of protein needed...
Mathematics Vision Project
Module 8: Modeling Data
Statistics come front and center in this unit all about analyzing discrete data. Real-world situations yield data sets that the class then uses to tease out connections and conclusions. Beginning with the basic histogram and...
Radford University
Sleep and Teen Obesity: Is there a Correlation?
Does the number of calories you eat affect the total time you sleep? Young mathematicians tackle this question by collecting their own data and making comparisons between others in the class through building scatter plots and regression...
Radford University
Are You Faster than Bacteria?
Just how fast does bacteria grow? Over the course of three lessons, pupils investigate exponential growth with the use of bacteria growth. During the lesson, bacteria from a cell phone is grown to make a connection to real life. Using...
CK-12 Foundation
Ck 12: Applications of Function Models
[Free Registration/Login may be required to access all resource tools.] A collection of resources for exploring word problems using function models.
Texas Education Agency
Texas Gateway: Modeling Data With Linear Functions
Given a scatterplot where a linear function is the best fit, the student will interpret the slope and intercepts, determine an equation using two data points, identify the conditions under which the function is valid, and use the linear...
Thinkport Education
Thinkport: Algebra Ii: Linear, Quadratic and Exponential Regression
Review linear regression and analyze how well this model fits the data. You will also be introduced to residuals and the correlation coefficient, and use these tools to determine whether or not a linear model is the best fit for a set of...
Thinkport Education
Thinkport: Algebra Ii: Regression
Build on your understanding of modeling with linear, quadratic and exponential functions to begin to include other function families.
CK-12 Foundation
Ck 12: Algebra: Applications of Function Models
[Free Registration/Login may be required to access all resource tools.] In this lesson students draw a scatter plot of data, find and draw the function that best fits that data, and make predictions from that information. Students watch...
TeachEngineering
Teach Engineering: Latex Tubing and Hybrid Vehicles
This unit gives students the opportunity to make use of linear models in order to make predictions based on real-world data. Students experience how engineers address incredible and important design challenges through the use of linear...
Khan Academy
Khan Academy: Fitting Quadratic and Exponential Functions to Scatter Plots
Determine if a quadratic or exponential model fits a data set better, then use the model to make a prediction. Students receive immediate feedback and have the opportunity to try questions repeatedly, watch a video or receive hints.


