The New York Times
The Careful Reader: Teaching Critical Reading Skills with the New York Times
The 11 lessons in this educators' guide focus on using newspapers to develop critical reading skills in the content areas.
Beyond Benign
Municipal Waste Generation
Statistically, waste may become a problem in the future if people do not take action. Using their knowledge of statistics and data representation, pupils take a look at the idea of waste generation. The four-part unit has class members...
Mathematics Vision Project
Module 2: Systems of Equations and Inequalities
The brother-sister pair Carlos and Clarita need your class's help in developing their new pet sitting business. Through a variety of scenarios and concerns presented to the siblings, the learners thoroughly explore systems of equations...
Curated OER
Second Graders Create Their Own Social Studies Book (Part I, The 5Ws of the Constitution)
Students develop their own social studies textbook using a blank theme book as they complete activities and learning experiences throughout the year. The activities are in art, music, simulations, read alouds, shared writing and a class...
Curated OER
From Sea to Shining Sea
Students study the geography of the United States of America. Students write letters, create travel brochures, make maps, graph population numbers, read fiction and nonfiction selections, complete KWL charts, and watch films.
Curated OER
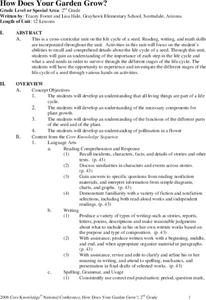
How Does Your Garden Grow?
Students complete activities to learn about the life cycle of a seed. In this plant growth lesson, students complete activities for the life cycles of seeds.
Curated OER
The Four Seasons with "Charlotte's Web"
Students explore the characters and plot of the story, "Charlotte's Web" through the twenty-two lessons of this unit. Characters, facts, and details of the story are recalled and discussed and form the basis of several activities in this...
Education Development Center
Tune in to Learning: Reading Charts and Graphs
Practice graph reading skills with these exercises and companion tutorials.
Texas Education Agency
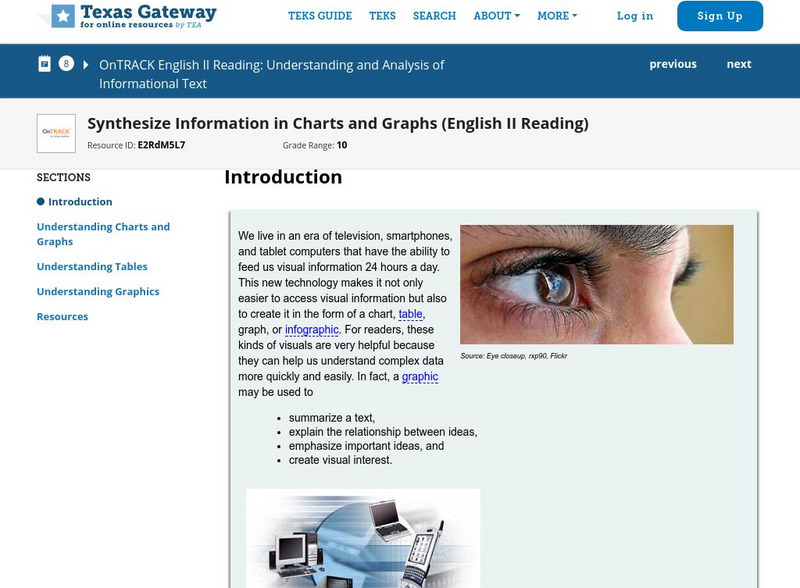
Texas Gateway: Informational Text: Synthesize Information in Charts and Graphs
In this lesson, you will learn how to understand the data found in charts and graphs, and at the end of the lesson, you will practice what you have learned.
Texas Education Agency
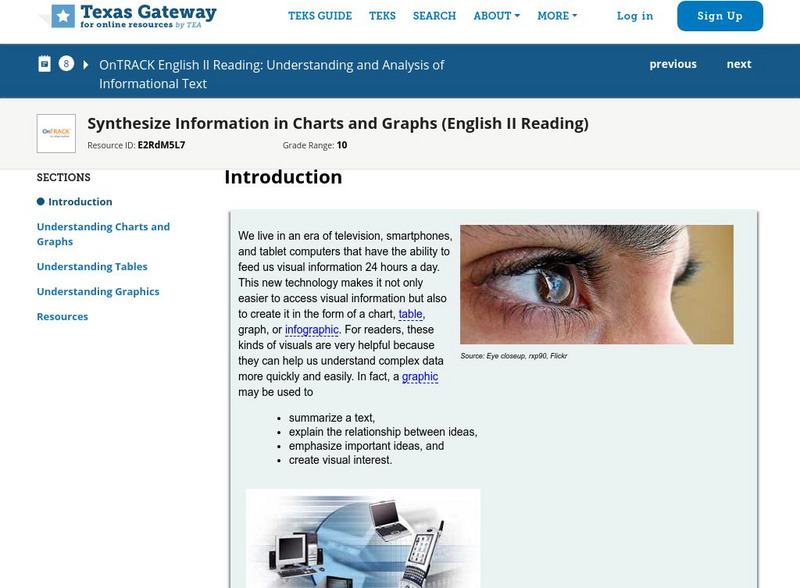
Texas Gateway: Synthesize Information in Charts and Graphs (English Ii Reading)
Synthesize information that you find in charts and graphs.
Texas Education Agency
Texas Gateway: Synthesize Information in Charts and Graphs (English Ii Reading)
Synthesize information that you find in charts and graphs.
Texas Education Agency
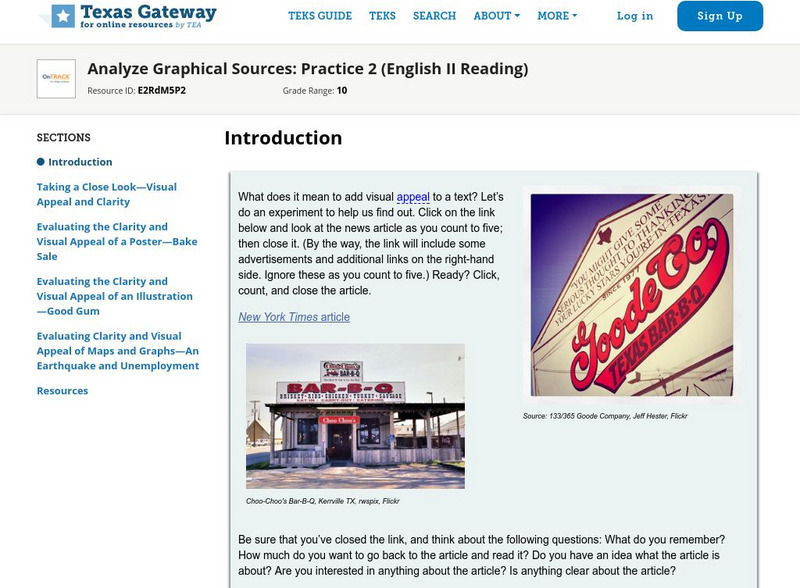
Texas Gateway: Analyze Graphical Sources: Practice 2 (English I Reading)
This lesson focuses on practice exercises to understand and interpret the data in a graphic representations including pie charts, bar graphs, and line graphs.
Texas Education Agency
Texas Gateway: Evaluating Data in Tables, Graphs and Charts
[Accessible by TX Educators. Free Registration/Login Required] In this lesson students look at examples of graphics, tables, charts, and graphs, and learn how to interpret their data. They will be able to use this skill to enhance their...
Khan Academy
Khan Academy: Read Histograms
Practice reading and interpreting histograms. Students receive immediate feedback and have the opportunity to try questions repeatedly, watch a video or receive hints.
Texas Education Agency
Texas Gateway: Analyze Graphical Sources: Practice 2 (English Ii Reading)
[Accessible by TX Educators. Free Registration/Login Required] Analyze the factual, quantitative, and technical data in graphs and charts.
Khan Academy
Khan Academy: Reading Dot Plots & Frequency Tables
Practice reading basic dot plots and frequency tables. Students receive immediate feedback and have the opportunity to try questions repeatedly, watch a video or receive hints.
Texas A&M University
Wtamu Virtual Math Lab: Beginning Algebra: Reading Graphs
A good introduction to reading bar, line, and double line graphs, and drawing and reading Venn diagrams. Contains definitions and examples of these types of charts and graphs as well as practice exercises that ask you to answer questions...
Texas Education Agency
Texas Gateway: Analyze Graphical Sources: Practice 2 (English I Reading)
Analyze the factual, quantitative, and technical data in graphs and charts.
Concord Consortium
Concord Consortium: Stem Resources: Describing Velocity
An interactive module where students record their ideas in response to questions, and read and manipulate graphs and charts while they learn about velocity-time graphs and position-time graphs.
E-learning for Kids
E Learning for Kids: Math: Tea Store: Reading a Table
Students will demonstrate how to interpret information in a table.
TeachEngineering
Teach Engineering: Engineering for the Earth
Young students are introduced to the complex systems of the Earth through numerous lessons on its natural resources, processes, weather, climate and landforms. Key earth science topics include rocks, soils and minerals, water and natural...
Texas Education Agency
Texas Gateway: Evaluate a Text for Its Graphics and Visual Appeal
Evaluate a text for the clarity and appeal of its graphics.
Texas Education Agency
Texas Gateway: Evaluate Graphics in Informational/procedural Text
[Accessible by TX Educators. Free Registration/Login Required] In this lesson, you will learn to explain the function of the graphical components. You will also learn to evaluate graphics on how well they do what they are intended to do.
Texas Education Agency
Texas Gateway: Synthesize Ideas in Informational/expository Text
[Accessible by TX Educators. Free Registration/Login Required] Learn how to synthesize and make logical connections between ideas within a text and across two or three texts representing similar or different genres and to support the...


