Mathed Up!
Pie Charts
Representing data is as easy as pie. Class members construct pie charts given a frequency table. Individuals then determine the size of the angles needed for each sector and interpret the size of sectors within the context of frequency....
Balanced Assessment
Movie Survey
Movie preferences will get your classes talking! Individuals read a pie graph and construct a bar graph using the same information. They then answer questions specific to the data and sample size.
Math Worksheets Land
Reading and Making Pie Graphs Worksheets
The opportunities are endless with a collection of five worksheets that enable young mathematicians to read pie graphs. Individuals use graphs to answer eight multiple choice questions on each sheet. The set of five allows for...
Curated OER
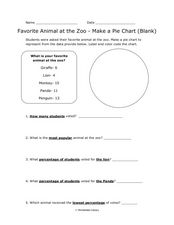
Pie Chart: Favorite Animal at the Zoo
In these three interpreting a pie chart and answering questions worksheets, students use the data provided to label and color code the blank and outlined pie charts, read and interpret a completed pie chart, and then answer questions...
Curated OER
Pies and Percentages--Learning About Pie Graphs
In this pie graph worksheet, students draw a pie graph for the zookeeper with the data he collected, choose a different color for each animal species and make a key to the graph.
Math Worksheets Land
Pie or Circle Graphs - Matching Worksheet
It's one thing to be able to read a pie graph, but it's another to analyze a pie graph and match it to its data table. Use a multiple choice activity when challenging learners to practice this skill. With six...
Curated OER
Reading and Making Pie Graphs
In this pie graphs instructional activity, students solve 10 different problems that include reading a pie graph. First, they use the pie graph to respond to 5 questions that follow. Students determine the year that had the smallest and...
Curated OER
My Test Book: Reading Pie Charts
In this math skills worksheet, students solve 9 multiple choice math problems that require them to read and interpret charts. Students may view the correct answers.
K12 Reader
Displaying Data
It's important to learn how to display data to make the information easier for people to understand. A reading activity prompts kids to use context clues to answer five comprehension questions after reading several paragraphs about...
CPO Science
Science Worksheets
If you need an array of worksheets to augment your science lessons, peruse a collection of assignments that is sure to fit your needs. With topics such as metric conversion, the scientific method, textbook features, research skills,...
Curated OER
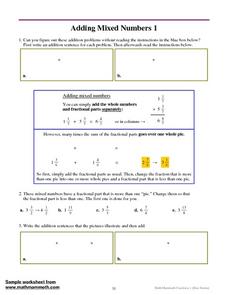
Adding Mixed Numbers 1
In this adding mixed numbers learning exercise, students write addition sentences using pie charts, add mixed numbers with the same denominator, and write mixed numbers as fractions in simplest form. Students solve nine problems.
Curated OER
Jim, Tony, and Frank-The School Fund-raiser (Graphing)
In this graphing worksheet, students view a pie chart. Students use their graphing knowledge to interpret the pie chart and answer ten questions. There is an answer sheet.
Curated OER
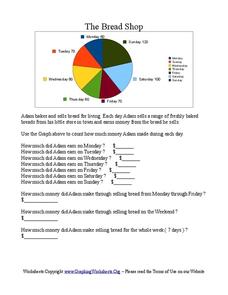
The Bread Shop
In this pie chart activity, students use the pie chart graph to count the money Adam made in the Bread Shop. Students complete 10 questions.
Curated OER
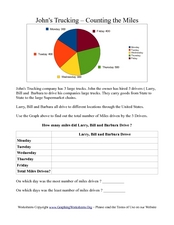
John's Trucking- Counting the Miles
For this graphs worksheet, students analyze a pie graph showing miles driven by three truck drivers in a week. Students fill out a chart in which they calculate total miles driven.
Curated OER
Deciding Which Type of Graph is Appropriate
In this graphing worksheet, students read about line, bar, and pie graphs and then determine which graph is the best way to express data results. This worksheet has 3 short answer questions.
Curated OER
Cindy and Linda - Selling Lemonade
In this pie charts worksheet, students use the pie chart to count how many glasses of Lemonade were sold by Cindy and Linda. Students complete the table and answer 3 questions.
Curated OER
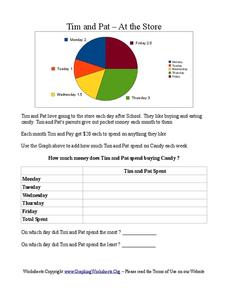
Tim and Pat - At the Store
For this pie chart worksheet, students use the pie chart to add the amount of time Tim and Pat spend buying candy each day of the week. Students answer 2 questions about the table.
Beyond Benign
Plastic Bags
Paper or plastic? Explore the environmental effects of using plastic bags through mathematics. Learners manipulate worldwide data on plastic bag consumption to draw conclusions.
Curated OER
Collecting Data
In this data collection worksheet, students read about how data is collected and organized. They also learn about a hypothesis. Students read through examples of different charts and then answer 23 questions pertaining to data...
Curated OER
Thinking About Technology: What Is It? How Can It Help Us?
What is technology and how can it help us? Using a instructional activity, students read a list and choose practical applications of scientific knowledge, brainstorm examples of home, school and hospital technology, graph answers in a...
Curated OER
Circle Graphs
In this circle graphs worksheet, students solve 10 different problems that include reading various circle graphs. First, they use graph 1 to determine how many students preferred which sport. Then, students use graph 2 to determine the...
Open Text Book Store
Arithmetic for College Students: Worksheets
Loaded with concepts ranging from multiplying decimals to converting units to solving problems using the order of operations, a thorough practice packet is perfect for a fifth or sixth grade math classroom.
Curated OER
Informational Reading: Electronics Are Made from Resources
In this comprehension learning exercise, students read about the making of a computer: circuit boards, hard drives, monitors and plastic housings. Students then answer 3 multiples choice questions.
Curated OER
Adolescent Vegetarianism
In this health worksheet, students read about adolescent vegetarians. Students also analyze a pie chart that shows that percent contribution of zinc by dietary source in the US.


