PBS
The Lowdown — Exploring Changing Obesity Rates through Ratios and Graphs
Math and medicine go hand-in-hand. After viewing several infographics on historical adult obesity rates, pupils consider how they have changed over time. They then use percentages to create a new graph and write a list of questions the...
Illustrative Mathematics
Baseball Cards
Here is a resource that demonstrates growth and the initial state of an equation. In this case, your class will be looking at baseball collections. How many baseball cards did the collector start out with, and how many were added or...
Utah Education Network (UEN)
Linear Relationships: Tables, Equations, and Graphs
Pupils explore the concept of linear relationships. They discuss real-world examples of independent and dependent relationships. In addition, they use tables, graphs, and equations to represent linear relationships. They also use ordered...
Illustrative Mathematics
Velocity vs. Distance
At the end of this activity, your number crunchers will have a better understanding as to how to describe graphs of velocity versus time and distance versus time. It is easy for learners to misinterpret graphs of velocity, so have them...
Illustrative Mathematics
Currency Exchange
Take your class on a North American adventure with a currency conversion problem. Pupils are asked to change US dollars into Canadian dollars and then to Mexican pesos. The commentary includes two solutions, converting by unit rates and...
Inside Mathematics
Swimming Pool
Swimming is more fun with quantities. The short assessment task encompasses finding the volume of a trapezoidal prism using an understanding of quantities. Individuals make a connection to the rate of which the pool is filled with a...
Illustrative Mathematics
DVD Profits, Variation 1
The idea in the resource is to understand the connections between proportional relationships, lines, and linear equations. To stay within the context of the standard, skip the part of the resource that solves with unit rates. Instead,...
Curated OER
Algebra I: Linear Functions
Using rates from a rental car company, young mathematicians graph data, explore linear relationships, and discuss the role of slope and the y-intercept. This lesson allows for the discussion of independent and dependent variables, as...
Curated OER
Drug Sales Soar - Rate of Change
In this prescription drug worksheet, students answer short answer questions and create graphs on the sales of prescription drugs over a five year span. Students complete six questions.
Curated OER
Slope & Rate of Change
This short handout addresses the concept of slope in two different ways: geometrically and analytically. Start with a brief description of slope, then use graphical representations to compare positive vs. negative slope and zero vs....
101 Questions
Hot Dog Eating
It's extremely important to pace yourself. Scholars watch portions of a video of the 2014 Nathan's Hot Dog Eating Contest. Using pictures that show one contestant's number of hot dogs at various times, they use rates to estimate how many...
Illustrative Mathematics
Delivering the Mail
A mail truck travels the same amount of miles per day. It will be up to your algebra learners to find an equation for this mailman’s truck. One needs a good understanding of rate of change and the initial value for this model. The...
Curated OER
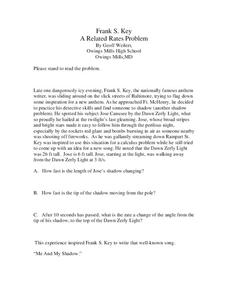
A Related Rate Problem
In this algebra worksheet, students calculate the rate of change as it relates to height and length. This is a word problem with 3 specific math questions as to how Frank S. Key came up with the song "Me and My Shadow"
Curated OER
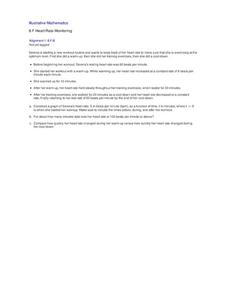
Heart Rate Monitoring
Algebra learners like this resource because it is easy to understand and it relates to their lives. Whether you are starting a new workout routine, or just climbing the stairs, your heart rate increases and decreases throughout the day....
Curated OER
Human Population- Changes in Survival Rates Data Interpretation
In this human population changes in survival worksheet, students interpret and plot data to understand the differences in human mortality and survivorship between historic and modern times. They investigate how these changes influence...
101 Questions
Slow Church
The church that just can't stay put! A video presentation raises questions of just how far the church will move. Presented with the rate of movement and a range of time expected, scholars build an inequality to answer the question.
Curated OER
Explain the Change
Twelfth graders complete research relating to population changes in counties/states in the U.S. from 1900 to 2000 and use the slope formula to determine the overall change in population for each of the ten decades. They present their...
Sri Atmananda Memorial School
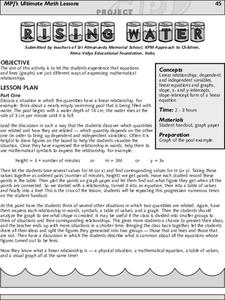
Rising Water
An engaging, and not to mention attractive, lesson plan has prealgebra and beginning algebra scholars examining linear relationships. They consider the rising water level as a swimming pool is being filled. They do so by charting and...
Curated OER
Working with Rates
In this working with rates worksheet, students solve 9 problems where they find the rates, they solve 5 problems where they find the rates for compound units and they solve 5 problems where they find the rates using scientific notation.
Curated OER
Mini Examination #2 - Limits and Derivatives
In this limits and derivatives worksheet, students solve 18 multiple choice and short answer questions. Students find the limits and derivatives of functions.
Willow Tree
Line Graphs
Some data just doesn't follow a straight path. Learners use line graphs to represent data that changes over time. They use the graphs to analyze the data and make conclusions.
Council for Economic Education
Loan Amortization - Mortgage
When you buy a home for $100,000, you pay $100,000—right? On the list of important things for individuals to understand, the lesson presents the concept of interest rates and loan amortization using spreadsheets and online sources....
PBS
The Lowdown — Poverty Trends: What Does It Mean to Be Poor in America?
Here's a resource that's rich with learning opportunities. Future mathematicians investigate the poverty rate in America over time. They use an interactive to compare the poverty rate during the Great Recession of 2008 to other years,...
PBS
The Lowdown — What You Need to Know about Immigration Reform
We're all from somewhere. An informative interactive provides information on immigration, foreign-born residents, and deportations. Pupils interpret the graphics to analyze how these quantities have changed over time. The resource is...
Other popular searches
- Slope Rate of Change
- Constant Rate of Change
- Average Rate of Change
- Powerpoint Rate of Change
- Rate of Change Math
- Rate of Change Graphs
- Rate of Change Algebra
- Heart Rate Change
- Rate of Change Project
- Slope and Rate of Change
- Exchange Rate Changes
- Rate of Change" Tables


