Curated OER
College Athletes
When more basketball players are taller than field hockey players at a school, is it safe to say that in general they are always taller? The activity takes data from two college teams and your learners will be able to answer questions...
Regents Prep
Activity to Show Sample Population and Bias
There is bias in many aspects of our lives, and math is no exception! Learners explore provided data to understand the meaning of biased and random samples. The resource includes various data sets from the same population, and...
Statistics Education Web
What Percent of the Continental US is Within One Mile of a Road?
There are places in the US where a road cannot be found for miles! The lesson asks learners to use random longitude and latitude coordinates within the US to collect data. They then determine the sample proportion and confidence interval...
Flipped Math
Sampling Methods
Pupils watch a video to learn about different types of sample design and how to use technology to create a random sample. They discover different types of bias that may happen due to the sampling design or the questions. Learners use...
American Statistical Association
How Long Are the Words in the Gettysburg Address?
It's 268 words, but one only needs to consider 10 of them at a time. A data collection and analysis activity has learners investigate the lengths of words in the Gettysburg Address. They first self-select a sample of 10 words and...
EngageNY
Estimating Probability Distributions Empirically 2
Develop probability distributions from simulations. Young mathematicians use simulations to collect data. They use the data to draw graphs of probability distributions for the random variable in question.
EngageNY
Understanding Variability When Estimating a Population Proportion
Estimate the proportion in a population using sampling. The 20th installment in a series of 25 introduces how to determine proportions of categorical data within a population. Groups take random samples from a bag of cubes to determine...
College Board
2014 AP® Statistics Free-Response Questions
Turn a summative assessment into a formative assessment! The 2014 AP® Statistics exam shows learners the level of difficulty they will encounter on their end-of-course exams. Within the six items, the test highlights concepts such as...
Radford University
The Next Big Thing
Make sure the next product is a hit. An engaging task has scholars design an item to sell at a sports event and then conduct a marketing survey. They decide whether to use random sampling, stratified sampling, or cluster sampling, and...
US Department of Commerce
Exploring Sampling Variability - Higher Education Attainment Across The United States
More education in statistics is always beneficial. Given cards that provide the proportion of adults with bachelor's degrees in 10 random US states, scholars individually determine the sample percentage of states in which more than 30...
US Department of Commerce
Sample Means - Exploring Sampling Variability
Sample an excellent resource on sampling variability. Pupils analyze census data on the percentage of homes in each state that have Internet access. They take random samples of different sample sizes, determine the sample means, and then...
Discovery Education
Fuss About Dust
Dust is everywhere around us; it's unavoidable. But what exactly is dust and are certain locations dustier than others? These are the questions students try to answer in an interesting scientific investigation. Working independently or...
Curated OER
Bringing Climate Change Into the Classroom
Learners investigate the greenhouse effect and examine the potential effects of climate change in the Arctic. They construct a mini-greenhouse and test its effect on temperature, analyze historical climate statistics, and conduct an...
Math Word Problems
Math Word Problems - Random Math Related Quizzes
One of the hardest things for children to learn when dealing with word problems is to determine what is being asked. This activity provides 5 basic addition and subtraction word problems, each contains a follow-up question which helps...
University of Minnesota
Memory Box
Teachers encourage using memory tricks, but do they actually work? Scholars test word association in a short yet engaging activity. They use 10 seconds to memorize as many items as possible and determine if they are more successful if...
Curated OER
Probability as a Decimal
In this probability as a decimal worksheet, students determine the probability of a number as a decimal. They draw a marble at random from a jar and calculate the probability given. Then, students roll a die numbered from 1 to 6 and...
Curated OER
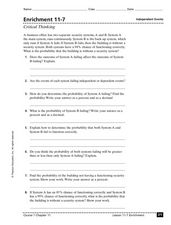
Independent Events
For this independent events probability worksheet, students solve 10 different problems that include determining the probability of certain events described. First, they determine the probability of selecting at random a number divisible...
Curated OER
Probability
In this probability worksheet, 8th graders solve 10 different problems that include determining a probability of events as a percentage. First, they determine the probability that a marble drawn will be green. Then, students determine a...
Curated OER
The Statistics Sampler
Students define sample, describe a random sample, and discuss what compromises a sample. They determine a sample size to estimate a population characteristic with confidence.
Curated OER
Random Acts of Kindness
Students make a bookmark. In this community lesson, students review the meaning of caring. They discuss how doing small acts of kindness can affect a community, and they make a bookmark to remind them to do kind things for others.
Curated OER
Costa Rica's Sustainable Coffee
Students experiment to see if birds prefer to eat bird seed with additives vs. no additives. In this experimental lesson students test to see if birds notice a difference between additive and no additive food.
Curated OER
Probability With a Random Drawing
Students define probability, and predict, record, and discuss outcomes from a random drawing, then identify most likely and least likely outcomes. They conduct a random drawing, record the data on a data chart, analyze the data, and...
Curated OER
Randomness and Information Worksheet
In this randomness worksheet, students calculate the probability of certain things happening by completing 4 different word problems.
Curated OER
Random Scenes
Students perform a group pantomime. In this cooperative efforts instructional activity, students are placed in small groups and must work as a team to pantomime a scene chosen at random. The students will engage in a reflection and class...
Other popular searches
- Random Acts of Kindness
- Random Sampling
- Random Numbers
- Random Mutations
- Random Remainders
- Random Number Generators
- Random Sampling Population
- Random Ballots
- Random Samples
- Random Statistics
- Random Search
- Simple Random Sampling


