Curated OER
US Airports, Assessment Variation
Determining relationships is all part of algebra and functions. Your mathematicians will decide the type of relationship between airports and population and translate what the slope and y-intercept represent. The problem is multiple...
EngageNY
Analyzing Residuals (Part 2)
Learn about patterns in residual plots with an informative math lesson. Two examples make connections between the appearance of a residual plot and whether a linear model is the best model apparent. The problem set and exit ticket...
Curated OER
Modeling Population Growth
Students create linear, exponential, and quadratic models of U.S. population data to determine which function best represents U.S. population growth. They predict future populations based on each model.
Kenan Fellows
Least Squares Linear Regression in R
The task? Determine the how effective hospitals are at reducing the rate of hospital-acquired infections. The method? Data analysis! Using an open source software program, individuals use provided data and create scatterplots to look for...
101 Questions
Deodorant
Smells like learning! Young scholars collect data on the length of time a stick of deodorant lasts. After modeling the data with a graph and function, they make predictions about deodorant use over time.
Curated OER
Stochastic and Deterministic Modeling
Explore the difference between stochastic and deterministic modeling through programming. First have the class write algorithms for relatively simple tasks using pseudocode. Use the Python 2.7 program app to simulate Mendel's Pea Pod...
101 Questions
What Micheal’s Coupon Should You Use?
Get your classes on their way to extreme couponing! Young mathematicians analyze two different coupon options for the better deal. They use different scenarios to predict and compare the outcomes.
Curated OER
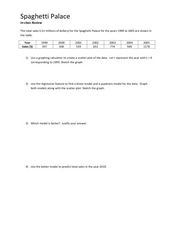
Spaghetti Palace
In this spaghetti palace worksheet sheet, learners examine data and create a scatter plot. They use their graphing calculator to find a linear model and a quadratic model for given information. Students predict total sales. This...
Curated OER
Strike a Pose: Modeling in the Real World (There's Nothing to It!)
Adjust this lesson to fit either beginning or more advanced learners. Build a scatter plot, determine appropriate model (linear, quadratic, exponential), and then extend to evaluate the model with residuals. This problem uses real-world...
Curated OER
Graphing Linear Equations
Students graph linear equations. In this algebra lesson, students investigate the price of tolls in different states and create a graph. They analyze their graph and draw conclusions.
Kenan Fellows
Lego Thinking and Building
Run a simulated airplane manufacturing plant with your pupils as the builders! Learners build Lego airplane models and collect data on the rate of production, comparing the number produced to the number defective. Using linear...
EngageNY
Informally Fitting a Line
Discover how trend lines can be useful in understanding relationships between variables with a lesson that covers how to informally fit a trend line to model a relationship given in a scatter plot. Scholars use the trend line to make...
Beyond Benign
The Big Melt: Arctic Ice Caps
Are the Arctic ice caps really melting out of existence? Junior climatologists examine the statistics of ice decline through four math-based lessons. Each activity incorporates data, climate information, and environmental impact into an...
Curated OER
Walk-A-Thon
Students graph linear http://www.lessonplanet.com/review?id=180542equations. In this problem solving lesson, students calculate slope and plot ordered pairs on a coordinate grid. Using a real-life example of a walk-a-thon, students...
Virginia Department of Education
Line of Best Fit
Pupils work through a guided activity on fitting a linear equation to a set of data by entering the data into a calculator and trying to envision a line of best fit. They then have the calculator determine the least-squares line and...
Curated OER
Graphing Real World Situations
Students solve linear equations using graphs. In this algebra instructional activity, students depict real life situation using lines and functions. They identify the slope, data and predict graphing behavior.
Curated OER
Modeling Population Growth
Learners collect data on population growth. In this statistics lesson plan, students graph their data and make predictions. They find the linear regression and the best fit line.
Curated OER
Using Representations to Model Problems
student make predictions or draw conclusions based on physical and visual representations of profit and sales. They model problems with physical materials and visual representations, and use models, graphs and tables to draw conclusions...
Curated OER
Price of Apples- Linear Data
Students collect data and create a graph. In this algebra lesson, students describe functions graphically, algebraically and verbally. They identify functions as being independent and dependent using variables.
Curated OER
How Do They Relate? Linear Relationship
Students collect information and use a line to represent it. In this algebra instructional activity, students investigate real world data to see if it makes a line. They graph the line comparing the relationship of the x axis with that...
National Security Agency
It's Probably Probable
Learners make predictions and draw conclusions from given information as they learn the meaning of probability in this vocabulary-rich, integrated activity that presents a variety of teaching strategies to motivate and reach all learning...
Curated OER
Baseball Relationships - Using Scatter Plots
Students use graphing calculators to create scatter plots of given baseball data. They also determine percentages and ratios, slope, y-intercepts, etc. all using baseball data and statistics.
Curated OER
What are the Odds
Students predict the-outcome of an event. In this algebra lesson, students compare and contrast the probability of an event occurring. They calculate the odds of a simple event and make estimation.
Radford University
A Change in the Weather
Explore the power of mathematics through this two-week statistics unit. Pupils learn about several climate-related issues and complete surveys that communicate their perceptions. They graph both univariate and bivariate data and use...


