California Education Partners
Speedy Texting
Model the effects of practice on texting speed. Pupils develop a linear equation that models the change in texting speed based on the amount of practice. The sixth performance task in an eight-part series requires learners to solve...
Mathematics Vision Project
Module 7: Modeling with Functions
The sky's the limit of what you create when combining functions! The module begins with a review of transformations of parent functions and then moves to combining different function types using addition, subtraction, and...
Workforce Solutions
Speed Interviewing
An important part of the job search process is the personal interview. Help pupils prepare with speed interviewing activity—teams of three-act as a job seeker, interviewer, and observer. Every three minutes, participants rotate roles and...
Curated OER
What is the Value of the Car?
Students practice determining the value of cars. Using the internet, they complete a worksheet in which they list the make of each car and use the data to determine the value. They share their results with the class and identify the most...
Curated OER
Introducing the Concept: Ordered Pairs
Students review ordered pairs. In this graphing lesson, students review ordered pairs with the teacher. This lesson includes a brief teacher script to help guide the students in understanding.
Illustrative Mathematics
Graphs of Compositions
It might help when working with this resource to give an example of a composition function. For example, the amount of time it takes to get to work depends on the amount of traffic; the amount traffic depends on the time of day....
Curated OER
Fractions, Decimals and Percents
Students investigate the differences when using decimals, fractions, and percents. They focus on the process of using them in real problems and how to convert them from one form to another.
Louisiana Department of Education
Fractions, Decimals, and Percents
Fractions, decimals, and percents all say the same thing! Show your classes how to convert between the three forms using visual and numeric representations. Then lead them to an understanding of scientific notation.
Curated OER
Game Board Review
Young scholars review previously taught material by playing a teacher made board game. They answer questions and move their pieces along the path to the end.
Curated OER
Fraction Conversion Lesson Plan
Students practice converting fractions into decimals and percents using a computer applet and the concept of money.
Science Matters
Island Fox Outreach
Off the coast of California lives a wild animal called the Island Fox. Experts discuss the importance of the Island Fox to the Channel Islands and the balance the fox creates within its ecosystem. The lesson concludes with a reading of...
Curated OER
60-30-10
Students use ratios and proportions to represent quantitative relationships as they investigate the concept of how percentages are used by designers. Students decorate the same room using three different percentages of colors.
Curated OER
A Fishy Tale
Eighth graders do a research project on a particular species of Atlantic seafood and record and graph information pertaining to commercial landings of that species of seafood. They use a website and an Appleworks spreadsheet.
Curated OER
Endangered Animals
Students listen to a teacher led lecture on jaguars, their habitats, and how they became endangered. Using a specified web site, they choose an endangered animal to research. After gathering information, students participate in...
Curated OER
Grids
Take your study of coordinates online! Groups of students complete an online graphing introduction, plotting the points of virtual objects. A worksheet is included for extra practice.
Curated OER
A McTrip Back In Time
Students pretend they are time-travellers and travel back to 1954 to a McDonald's Restaurant to see how prices have changed. They need to add and subtract money with regrouping.
Curated OER
Using Integers to Show Differences
In this integer worksheet, students use integers to show differences in temperatures by solving 7 short word problems. They find the differences in 7 more equations.
Curated OER
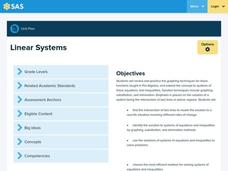
Linear Systems
Students solve and graph linear equations. In this algebra lesson, students solve systems of equations using elimination and substitution. They graph their answer and identify the point of intersection.
Curated OER
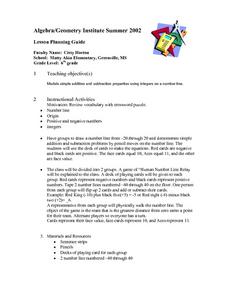
Addition & Subtraction Properties With Integers
Sixth graders use a number line to solve addition and subtraction problems. In groups, they play a game of "Human Number Line Relay." They use a deck of cards to randomly create addition and subtraction equations and physically walk a...
Curated OER
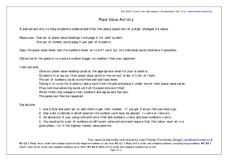
Place Value Activity
In this place value worksheet, students in pairs shuffle a set of place value cards and then lay them out face down on a table. Students then draw a card and place it under one of their place value cards.
Curated OER
Graphing on a Coordinate Plane
Eighth graders explore the coordinate system. They identify the x and y-axis, parts of the coordinate plane, and discuss the process of plotting points. To emphasize the process of plotting points, 8th graders play an ordered pair...
Curated OER
The Stock Market-Tracking and Picking Stocks
Young scholars interpret the stock market. They pick preferable stocks based on price to earnings ratios listed in the quotes. They practice using fractions and decimals to calculate the cost of selling and buying various stocks...
Curated OER
The Coordinate Plane
Fifth graders use the attached worksheet, Where's My Location? - Directions, to play a game in which they plot points on a grid.
Curated OER
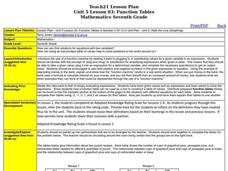
Function Tables
Students identify function using tables of data. In this algebra lesson, students create a tale of point and plot on a coordinate plane. They analyze the graph as being a function or not.


