Howard Hughes Medical Institute
Patterns in the Distribution of Lactase Persistence
We all drink milk as babies, so why can't we all drink it as adults? Examine the trend in lactase production on the world-wide scale as science scholars analyze and interpret data. Groups create pie charts from the data, place them on a...
EngageNY
Margin of Error When Estimating a Population Mean (part 1)
We know that sample data varies — it's time to quantify that variability! After calculating a sample mean, pupils calculate the margin of error. They repeat the process with a greater number of sample means and compare the results.
EngageNY
Margin of Error When Estimating a Population Mean (part 2)
Don't leave your classes vulnerable in their calculations! Help them understand the importance of calculating a margin of error to represent the variability in their sample mean.
Curated OER
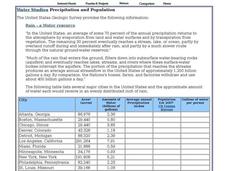
Water Studies: Precipitation and Population
For this water worksheet, students complete the chart about precipitation and population and answer short answer questions. Students complete 14 rows in the chart and answer 4 questions.
Curated OER
Confidence Intervals: Population Mean; Population Standard Deviation Unknown
In this confidence interval worksheet, students examine given statistical information to find the margin of error. They construct a confidence interval for the population and find the mean. Seven statistical problems are available on...
EngageNY
Sampling Variability in the Sample Proportion (part 2)
Increase your sample and increase your accuracy! Scholars complete an activity that compares sample size to variability in results. Learners realize that the greater the sample size, the smaller the range in the distribution of sample...
Curated OER
In the Wake of Columbus
Students explore how the population decreased in native cultures.
Chapman University
Scientific Alphabet Chart - Get to Know Your Greek Alphabet
Greek alphabet letters are used to represent words or values in science and math. Keep a list on hand to refer to while working through calculus or physics problems.
Rice University
Introductory Statistics
Statistically speaking, the content covers several grades. Featuring all of the statistics typically covered in a college-level Statistics course, the expansive content spans from sixth grade on up to high school. Material...
US Department of Commerce
Featured Activity: Let’s Get the Count Right
Don't leave anyone out. To highlight the importance of the US Census to younger learners, an activity has them distribute markers to see if there are enough for each person. They see that counting the population is necessary to fairly...
Curated OER
Population-Building a Foundation
Students research to find information about populations and complete world maps by labeling the current population, and determining the 10 countries with the largest population. They search the "World Population Data Sheet." On the third...
Curated OER
Visualizing the Aging Population
Students examine the needs for products and services for the aging. In this entrepreneur lesson plan, students compare and contrast the age distribution of different countries and the needs of this population.
Mathematics Vision Project
Module 9: Modeling Data
How many different ways can you model data? Scholars learn several in the final module in a series of nine. Learners model data with dot plots, box plots, histograms, and scatter plots. They also analyze the data based on the data...
Curated OER
Candy Bars
There is often more to data than meets the eye. Scholars learn that they need to analyze data before making conclusions as they look at data that describes the number of candy bars boys and girls eat. They disprove a given conclusion and...
Achieve
BMI Calculations
Obesity is a worldwide concern. Using survey results, learners compare local BMI statistics to celebrity BMI statistics. Scholars create box plots of the data, make observations about the shape and spread of the data, and examine the...
Radford University
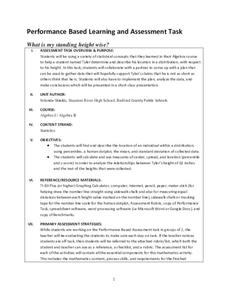
What is My Standing Height Wise?
Given a scenario in which a class member wants to prove his height is not an outlier, pairs devise a plan and gather evidence to help support his claim. The small groups implement their plans and create graphical displays of their data...
Mathed Up!
Fractions of an Amount
After viewing a video on fractional amounts, young mathematicians put their new knowledge to the test. Throughout the assessment, class members find the fractional amount for prices, times, and populations. There are a few percent and...
Curated OER
Normal Curve Areas - Population
In this normal curve areas worksheet, learners follow 6 steps to compute the probability regarding the values from the population. First, they label x-scale with the mean and corresponding standard deviations and shade the area(s) under...
Curated OER
The Distributive Property
Students review how to solve problems using the Distributive Property of Mathematics. They solve problems using the paper and pencil method and then use the graphing calculator to discover the property over addition while making a visual...
Curated OER
Empirical Rule Practice Problems
Using the empirical rule for a normal distribution, young statisticians determine the percent of adult women with given heights and weights. They find the percentile rank of a woman of a stated height and find the area under a curve.
EngageNY
Sampling Variability in the Sample Mean (part 2)
Reduce variability for more accurate statistics. Through simulation, learners examine sample data and calculate a sample mean. They understand that increasing the number of samples creates results that are more representative of the...
College Board
2017 AP® Statistics Free-Response Questions
Reduce testing anxiety by helping learners prepare for test day. Scholars complete six free-response questions from a released AP® exam. The questions test a variety of concepts including confidence intervals, frequency tables,...
Curated OER
Normal Curve Areas
In this normal curve areas worksheet, students follow 6 steps to compute the probability regarding the possible sample of proportions using a large sample population. First, they label the Ps-scale with the proportion and corresponding...
Statistics Education Web
Did I Trap the Median?
One of the key questions in statistics is whether the results are good enough. Use an activity to help pupils understand the importance of sample size and the effect it has on variability. Groups collect their own sample data and compare...


