Curated OER
Population Change in Vermont, 1990-2000
Students improve their mapping skills and knowledge about population distribution and change in Vermont at the county level. They are divided into groups of two or four. Each group is given two county base maps and the population...
Curated OER
Human Populations Studies: the Ghost of Populations Past
Students compile data on population distribution and develop survivorship curves using information from cemetery tombstones and obituaries. They develop inferences on the changes in population age distribution in their area over time.
Curated OER
Population Pyramid
Students learn about demographic population pyramids. They then design and fictitious nation and draw its population pyramid.
Curated OER
Population and Productivity: Two P's in a Pod
Students investigate the link between countries' population growth rates and levels of industrialization. They observe that, over time, as a country becomes more industrialized, its population growth rate decreases.
Curated OER
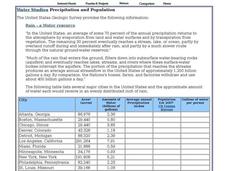
Water Studies: Precipitation and Population
For this water worksheet, students complete the chart about precipitation and population and answer short answer questions. Students complete 14 rows in the chart and answer 4 questions.
Curated OER
Social Studies: Population Distribution
Students create a population distribution map of Goodland Island indicating where people live by marking the locations with dots. After reading a written description of the island, they write short paragraphs explaining and justifying...
Curated OER
The Ghost of Populations Past
Students study population distribution and survivorship curves by collecting data regarding age of death of humans from either tombstones, newspapers, or other community resources. Students analyze data by creating graphs and population...
Curated OER
Populations
Take your ecology aces out in the field to practice population counts and model the benefits of camouflage. Though not particularly exciting, these activites and the assessments that are also included are practical and applicable to your...
Curated OER
Saskatchewan's Population Distribution
Students explore landforms, vegetation, climate and population distribution in Saskatchewan. After discussing an atlas of Saskatchewan, students create their own relief map and climagraphs of Saskathewan. Using specified websistes,...
Curated OER
In the Wake of Columbus
Students explore how the population decreased in native cultures.
Curated OER
Ecology and the Biosphere
Ecology enthusiasts explore ecosystems with this worksheet. They define vocabulary terms and write out answers to questions about distribution and abundance of life. They complete a chart comparing abiotic and biotic factors of Earth's...
CK-12 Foundation
Sampling Distribution of a Sample Mean: The Mean of the Average Ages
What does it mean to take the mean of the mean? An easy-to-use interactive has users adjust the mean ages of different samples. Finding the average of these sample means gives an estimate of the population mean.
Howard Hughes Medical Institute
Patterns in the Distribution of Lactase Persistence
We all drink milk as babies, so why can't we all drink it as adults? Examine the trend in lactase production on the world-wide scale as science scholars analyze and interpret data. Groups create pie charts from the data, place them on a...
Mathematics Vision Project
Module 8: Statistics
What does it mean to be normal in the world of statistics? Pupils first explore the meaning of a normal distribution in the eight-lesson module. They then apply the statistics related to normal distributions such as mean, standard...
Curated OER
Mapping Population Changes In The United States
Students create a choropleth map to illustrate the population growth rate of the United States. They explore how to construct a choropleth map, and discuss the impact of population changes for the future.
EngageNY
Sampling Variability in the Sample Mean (part 1)
How accurate is data collected from a sample? Learners answer this question using a simulation to model data collected from a sample population. They analyze the data to understand the variability in the results.
University of Southern California
How do Organisms Interact?
Examine how organisms interact through a hands-on experience. Learners study population dynamics and distribution during an informative five-lesson unit. The focus is on the ocean environment and the organisms within it.
California Academy of Science
Rapid Brainstorming: How Can We Improve Our Global Food System?
In 2018, the average fast food burger cost $2.64 while a salad averaged $4.14. Does the price difference matter to public health? Scholars consider that question and others in a brainstorming session about improving our global food...
Curated OER
Normal Curve Areas - Population
In this normal curve areas worksheet, learners follow 6 steps to compute the probability regarding the values from the population. First, they label x-scale with the mean and corresponding standard deviations and shade the area(s) under...
Curated OER
The Distributive Property
Students review how to solve problems using the Distributive Property of Mathematics. They solve problems using the paper and pencil method and then use the graphing calculator to discover the property over addition while making a visual...
Curated OER
Where is Everybody?
Students collect data from different grade levels at their school and develop thematic maps which show population density, and determine how this might affect the school and themselves in the future.
Curated OER
World Hunger - A Cultural Crisis
Students explore the problem of world hunger and starvation. After a class discussion, students use a map to identify specific areas where populations are starving. In groups, students research reasons for the lack of food. They prepare...
Curated OER
Whoa! Slow Down-Some of You!
Students analyze demographic data (growth rate, natural increase, fertility rate, crude birth rates, and crude death rates) and determine which areas of the world contain the fastest and slowest growth rates. They construct population...
Curated OER
Race and Ethnicity in the United States
Students explore race and ethnicity as it is defined by the U. S. Census Bureau. They compare data from 1900, 1950, and 2000 and identify settlement patterns and changes in population. In groups, they map these changes and discuss...


