Curated OER
Population Density
High schoolers examine world population density and population distribution. They create pie charts showing population distribution and analyze population patterns in the United States and major regions of the world. They identify...
Curated OER
What is the Population Distribution of Cartoon Characters Living On the Pages of Your Newspaper?
Students read various cartoons in their local newspaper and calculate the population demographics, spatial distribution and grouping of the characters. Using this information, they create a population distribution map and share them with...
Curated OER
Size It Up: Map Skills
Compare information from a US population cartogram and a standard US map. Learners draw conclusions about population density by analyzing census data a population distribution. They discover that census data is used to apportion seats in...
PBS
The New West: Interactive Map | A Biography of America
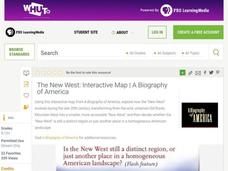
Using this interactive map activity, from A Biography of America, explore how the "New West" evolved during the late 20th century, transforming from the wild, untamed Old Rocky Mountain West into a smaller, more accessible "New West."...
Curated OER
Social Studies: Population Distribution
Students create a population distribution map of Goodland Island indicating where people live by marking the locations with dots. After reading a written description of the island, they write short paragraphs explaining and justifying...
Curated OER
Social Studies: Area and Population Density
Math scholars of many ages examine the concept of population density and then discuss the significance of the population densities of Minnesota and China. They figure the population density of their school.
National Gardening Association
Migration Mishaps
Elementary ecologists pretend to be migratory hummingbirds. They fly between wintering and nesting grounds, trying to reach a habitat haven. In a musical-chair fashion, some birds will miss out, and are removed from the game. To further...
Curated OER
Population Change in Vermont, 1990-2000
Students improve their mapping skills and knowledge about population distribution and change in Vermont at the county level. They are divided into groups of two or four. Each group is given two county base maps and the population...
Curated OER
These Maps are for the Birds
Students identify and study New York State Breeding Bird Atlas maps to learn where different bird species nest and how their distributions have changed over time. They also identify how maps serve as representations of a geographic...
Curated OER
Population and Productivity: Two P's in a Pod
Students investigate the link between countries' population growth rates and levels of industrialization. They observe that, over time, as a country becomes more industrialized, its population growth rate decreases.
Curated OER
Saskatchewan's Population Distribution
Students explore landforms, vegetation, climate and population distribution in Saskatchewan. After discussing an atlas of Saskatchewan, students create their own relief map and climagraphs of Saskathewan. Using specified websistes,...
Curated OER
Understanding "The Stans"
Students explore and locate "The Stans" in Central Asia to create, write and illustrate maps, graphs and charts to organize geographic information. They analyze the historical and physical characteristics of Central Asia via graphic...
Curated OER
Hunger in the World
Consider various aspects of world hunger in this writing instructional activity. After taking a pre-test, middle and high schoolers play a map game, analyze and discuss world statistics, and write a report on an assigned country. The...
Curated OER
As Simple as Beans: Canada's Population
Students gather facts about Canada from various maps. In this Canada lesson, students use beans to relate the populations of the U.S. and Canada. Students create population distribution maps based on the placement of the beans.
Curated OER
Lesson 1: Map Data and the Census
Young scholars learn about the history of the census. In this U. S. Census lesson plan, students develop an understanding about how the United States Constitution grants and distributes power and discover how the spatial organization of...
Curated OER
Mapping Population Changes In The United States
Students create a choropleth map to illustrate the population growth rate of the United States. They explore how to construct a choropleth map, and discuss the impact of population changes for the future.
Curated OER
Mapping Counties
Students practice reading a map. In this mapping lesson, students illustrate a map and compare and contrast the counties based on their population. Students also explore what a census is and read census data on a map. A student...
Curated OER
What in Our World Affects the Way People Live
Sixth graders study various maps that show geographical features and population. They compare the maps and make inferences about how various geographical features influence the population and human activities of an area.
Curated OER
Race and Ethnicity in the United States
Students explore race and ethnicity as it is defined by the U. S. Census Bureau. They compare data from 1900, 1950, and 2000 and identify settlement patterns and changes in population. In groups, they map these changes and discuss...
Curated OER
Where is Everybody?
Students collect data from different grade levels at their school and develop thematic maps which show population density, and determine how this might affect the school and themselves in the future.
Curated OER
World Hunger - A Cultural Crisis
Students explore the problem of world hunger and starvation. After a class discussion, students use a map to identify specific areas where populations are starving. In groups, students research reasons for the lack of food. They prepare...
Curated OER
Tools of the Trade: The Use of Geographic Tools
Students examine the tools of demographic analysis and apply them to real-world situations. They analyze maps, define terminology, and write an information paper for the appropriate government agency to recommend an action or policy change.
Curated OER
Distribution of children living at home
Students use E-STAT to examine demographics. In this social demographics instructional activity, students use statistical data to determine if a particular family is in need of assistance. Students will discuss social and educational...
