Curated OER
Halloween Point Plot
Practice graphing and plotting points with a festive Halloween flair! Scholars plot 21 points on a grid, connecting them to create a spooky shape!
Math Drills
Halloween Cartesian Art: Witch Hat
What is the mystery picture? After plotting points on the first quadrant of a Cartesian coordinate system, young mathematicians connect the points to create a Halloween-themed picture.
Charleston School District
Analyzing Scatter Plots
Scatter plots tell a story about the data — you just need to be able to read it! Building from the previous lesson in the series where learners created scatter plots, they now learn how to find associations in those scatter plots....
Math Worksheets Land
Halloween Cartesian Art: Bat
Get the class batty over graphing. Young mathematicians plot ordered pairs in all quadrants of a Cartesian plane, and connect the points to create a bat.
Math Drills
Christmas Cartesian Art Snowflake
A festive math worksheet hones graphic skills and keeps the season bright! Young mathematicians join points in the order they were graphed to create a snowflake picture.
Inside Mathematics
Snakes
Get a line on the snakes. The assessment task requires the class to determine the species of unknown snakes based upon collected data. Individuals analyze two scatter plots and determine the most likely species for five...
Curated OER
Boots
In this graphing practice worksheet, 5th graders plot squares on a graph with an x and y axis. Once students locate each square they must color a certain design in that box to create a larger picture.
Math Drills
Christmas Cartesian Art Tree
Spruce up graphing practice with an activity that has young mathematicians plot points on a coordinate plane, and then connect the points to create a Christmas tree.
Curated OER
Ordering Stories
What happened first? Learners examine four sets of images to sequence events using ordinal numbers. There is an example to get them started, and the first two have three pictures to organize. The final story is more challenging with four...
Curated OER
Graph a Picture on Cartesian Coordinates
Find out what picture is hidden in this graph and work on coordinate graphing with this worksheet! Learners plot 66 ordered pair points on a Cartesian graph, then connect the dots to make a picture. This would work as an in-class...
Inside Mathematics
Population
Population density, it is not all that it is plotted to be. Pupils analyze a scatter plot of population versus area for some of the states in the US. The class members respond to eight questions about the graph, specific points and...
Curated OER
You Can Get There From Here - Plotting on a Coordinate Plane
For this plotting worksheet, students plot given ordered pairs on a coordinate plane. After plotting each ordered pair, students connect line segments in consecutive order. Upon completion of the graphing exercise, students will have...
Math Drills
Christmas Cartesian Art Santa
Santa has his eye on you in a graphing activity that has young mathematicians plot ordered pairs on a Cartesian plane. After joining the points together, a picture of jolly Santa Claus comes to life.
Charleston School District
Graphing Functions
How do letters and numbers create a picture? Scholars learn to create input/output tables to graph functions. They graph both linear and nonlinear functions by creating tables and plotting points.
Concord Consortium
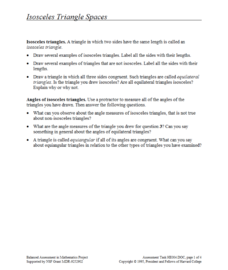
Isosceles Triangle Spaces
How many different types of triangles can your class name? A discovery lesson guides learners through an exploration of the different triangle types and the relationships between their angles and sides. Using coordinate geometry,...
K12 Reader
Points on a Coordinate Grid
Introduce your class to the basics of coordinate planes. The reading passage included here describes ordered pairs and the different quadrants on a coordinate grid. Learners read the passage and respond to five related questions.
Curated OER
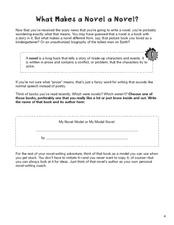
What Makes a Novel a Novel?
As your authors prepare to write a hypothetical novel, they need all the inspiration they can find! Using a book they have already read (and enjoyed), learners complete a literary analysis by filling in eight short-answer...
Curated OER
Scatterplots and Regressions
For this scatterplots and regressions worksheet, students solve 6 different types of problems related to graphing scatterplots and interpreting regressions. First, they create a scatterplot from the given data coordinates and then,...
Curated OER
Which is Closer to 1?
A seemingly simple question that reveals a lot about a student's understanding of fractions. In finding an answer, learners compare fractions with different denominators that are both greater and less than one. No number line is...
Curated OER
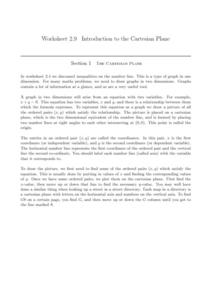
The Cartesian Plane
Learners solve and complete 22 various types of problems. First, they find the gradients of the lines and plot the given points. Then, they complete the table of values for each equation and use the table to draw the graph.
Illustrative Mathematics
Half of a Recipe
Kids love to cook! What is a better place to learn mixed numbers than with a recipe? It is up to learners to decide how they want to divide this recipe in half. They may choose to model the mixed number and then divide the model by two....
Curated OER
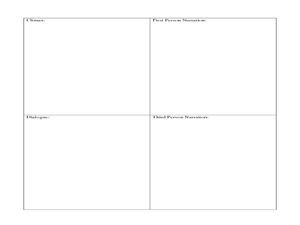
Illustrating the Elements of a Story
Explore the elements of a story with this two-page graphic organizer. Readers write and draw descriptions of each element, including setting, plot, conflict, rising action, climax, dialogue, and narration.
Curated OER
A Christmas Place
In this graphing worksheet, students plot the points on the graph to create a picture of a Christmas tree. Students plot 37 points and connect them where told to.
Curated OER
Melissa's Garden
In this math activity, students identify the location of pictures on a coordinate plane. They write some answers as an ordered pair. They read ordered pairs and identify the picture at a specified location. Six problems are on a page. An...


