Curated OER
Hands On: Plot Points on a Coordinate Grid
In this solving coordinate grid word problem worksheet, students plot points, order pairs, identify horizontal and vertical lines, and find distances to solve problems. Students solve six problems.
Curated OER
Plotting Points
In this coordinate pairs worksheet, students learn to plot points on a graph. Students study the examples and then complete 20 questions. This is intended as an online activity, but may be completed with pencil and paper.
Curated OER
Mapping Worksheet #1
Get out the compass and a pencil its time to use a coordinate grid to practice mapping skills. Young cartographers use the prompts and provided grid to plot locations, draw parallel lines, and determine distances between points.
Inside Mathematics
Coffee
There are many ways to correlate coffee to life, but in this case a instructional activity looks at the price of two different sizes of coffee. It requires interpreting a graph with two unknown variables, in this case the price, and...
EngageNY
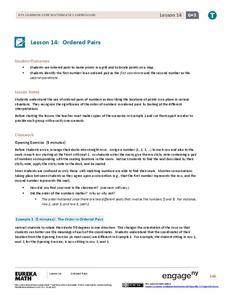
Ordered Pairs
Scholars learn to plot points on the coordinate plane. The activity introduces the idea that the first coordinate of a coordinate pair represents the horizontal distance and the second coordinate represents the vertical distance.
PBS
Working with Coordinate Planes: Activities and Supplemental Materials
Seven activities make up a collection of supplemental materials to reinforce graphing on a coordinate plane. Worksheet objectives include plotting coordinates within single and four quadrants, measuring straight and...
Curated OER
Topographic Mapping Skills
In this geography instructional activity, students read an excerpt about topographic maps and why they are useful for various jobs. They also respond to eleven questions that follow related to the excerpt and locating specific map points...
EngageNY
Distance on the Coordinate Plane
Scholars learn how to find the distance of vertical and horizontal line segments on the coordinate plane in the 19th installment of a 21-part module. The use of absolute value comes in handy.
Curated OER
Treasure Hunt
In this treasure hunt worksheet, students fill in the blanks with the correct coordinates. As students fill in the coordinates, they trace their route on a treasure map.
Curated OER
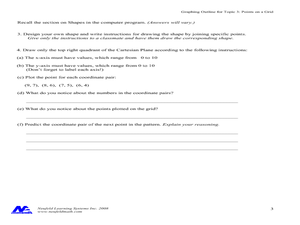
Concept: Points on a Grid
In this coordinate grid graphing worksheet, students play a game of Battleship on the computer. They answer 21 questions about the coordinate grid and graphing.
Curated OER
Representing Data 2: Using Box Plots
What information can be gleaned from a box and whiskers plot? Discuss the five summary values - minimum, maximum, upper and lower quartiles, and median - and what conclusions can be made from these values? Included here is a matching...
Jordan-Granite Consortium
Scatter Diagram
You aced the first test, so your score on the second one shouldn't matter, right? Young pupils first draw a best fit line on a provided scatter plot showing test scores for two different tests. They then evaluate five...
Mathematics Assessment Project
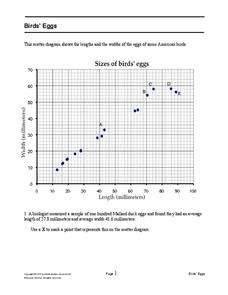
Bird’s Eggs
Are the length and width of birds' eggs related? Young ornathologists use a scatter plot to investigate the relationship between the length and width of eggs for Mallard ducks. They then determine the egg with the greatest...
Illustrative Mathematics
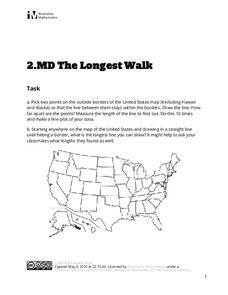
The Longest Walk
How long of a line can you draw within this activity? Learners pick two points outside and within the map to create the longest line they can. After drawing 10 lines, learners plot the length of each line on a line plot. Then they...
Mathematics Assessment Project
Sugar Prices
Sugar rush! For this assessment task, learners interpret points on a scatter plot representing price versus weight for bags of sugar. They then determine the bag that represents the best value.
Curated OER
The Oregon Trail
In this Oregon Trail worksheet, learners practice their map skills while they explore the states of Oregon, Missouri, Idaho, Nebraska, and Wyoming. Students us a map of the US to plot six points on the map that show the Oregon Trail.
Inside Mathematics
Scatter Diagram
It is positive that how one performs on the first test relates to their performance on the second test. The three-question assessment has class members read and analyze a scatter plot of test scores. They must determine whether...
K12 Reader
Absolute Location
Where in the world are we? As a reading comprehension exercise, kids read a short passage about navigation using latitude and longitude, and then respond to a series of questions based on the article.
California Education Partners
Animals of Rhomaar
Investigate the growth rates of alien animals. Pupils study fictional animals from another planet to determine how much they grow per year. The investigators plot the growth of their animals over a period of time and then compare...
Curated OER
Plotting Earthquakes
In this earthquakes worksheet, students access a website to gather information about the magnitude and location of earthquakes for 5 days. Then students complete 7 short answer questions.
Curated OER
Coordinates
In this coordinates worksheet, students analyze two maps and identify the coordinates of ten specific locations. Students plot sixteen points on a graph and check their answers online at the end of each exercise.
Curated OER
Representing Data 1: Using Frequency Graphs
Here is a lesson that focuses on the use of frequency graphs to identify a range of measures and makes sense of data in a real-world context as well as constructing frequency graphs given information about the mean, median, and range of...
Curated OER
Finding Ocean Depth
How to oceanographers measure the sea's depth? Your scientists will step into their shoes in this application worksheet, first reading about how the speed of sound and a simple formula give scientists a depth estimation. Students...
Curated OER
Applications of the Pythagorean Theorem - Magnetism
Middle and high schoolers use the Pythagorean Theorem to complete a table showing with the magnetic field strengths in given cities. They find the average value of the Earth's magnetic field and plot one of the three-dimensional values...


