Curated OER
Pie Charts
In this math worksheet, students complete the work in order to chart the data into the pie graph. The picture is used for statistical analysis.
Curated OER
Time Management: Piece of Pie
Learners examine their own lives and how well they manage their time outside of school. In this this time management instructional activity, students discover the amount of time they spend on other activities, and create a pie chart with...
Curated OER
Piece of Pie Chart
In this math worksheet, students examine a pie graph which shows a student's homework over 2 hours. Students read the information, then use a pie chart template (divided into 24 parts) to make their own homework chart.
Curated OER
Fractions: pie graphs, numbers, and bars
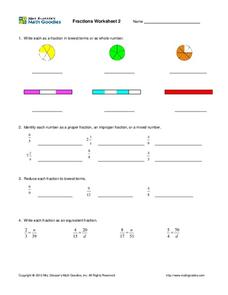
In this fraction worksheet, students complete fraction problems containing pie graphs, numbers, bars, proper fractions, lowest terms, and more. Students complete 19 problems.
Bowland
German or English?
Sprechen sie Deutsch? Future cryptographers must decide whether an unknown text is written in English or in German. They use provided pie charts about the frequency of words in the English and German languages to help make their decisions.
Howard Hughes Medical Institute
Patterns in the Distribution of Lactase Persistence
We all drink milk as babies, so why can't we all drink it as adults? Examine the trend in lactase production on the world-wide scale as science scholars analyze and interpret data. Groups create pie charts from the data, place them on a...
Curated OER
Solar Storm Energy and Pie Graphs
In this solar storm energy and pie graphs worksheet, learners solve 5 problems using pie graphs that show the amount of solar energy that is converted into radiation, kinetic energy, flare energy and flare energy that is lost to working...
Curated OER
Bar Graphs and Pie Charts
Young scholars graph data they collected and analyze it using a bar graph. In this algebra lesson, students analyze their data using pie charts and bar graphs while explaining the meaning to each other. They compare and contrast bar...
Math Worksheets Land
Pie or Circle Graphs - Matching Worksheet
It's one thing to be able to read a pie graph, but it's another to analyze a pie graph and match it to its data table. Use a multiple choice instructional activity when challenging learners to practice this skill....
Curated OER
My Test Book: Reading Pie Charts
In this math skills worksheet, students solve 9 multiple choice math problems that require them to read and interpret charts. Students may view the correct answers.
Curated OER
Favorite Animal at the Zoo - Making a Pie Chart
In this graphing and interpretation activity set, students draw charts that are either blank or outlined that show information about students' favorite zoo animals. They answer questions based on the data in 15 examples.
Math Moves U
Collecting and Working with Data
Add to your collection of math resources with this extensive series of data analysis worksheets. Whether your teaching how to use frequency tables and tally charts to collect and organize data, or introducing young...
Yummy Math
US Holiday Candy Sales
Candy is a big business! Calculate the amount of money consumers spent on major holidays—Easter, Halloween, Christmas, Hanukkah, and Valentine's Day—based on the total amount of candy sales from 2011 and the percentage of each holiday's...
PBS
The Lowdown — U.S. Gun Homicides: Visualizing the Numbers
Is gun violence a big issue in America? Pupils explore gun deaths by type, race, and age group in a Math at the Core: Ratios interactive. The class tries to determine whether America is a safe place to live and use bar graphs and pie...
Bowland
Ice Cream
Make sure there is enough ice cream on hand. Learners try to find out how much ice cream to buy for a sports event. Scholars use a pie chart showing the percent of a sample of people who like different flavors of ice cream. Using the...
Curated OER
Students Favorites
Students complete activities using a frequency table and construct a pie graph for the data. In this frequency table lesson, students complete a survey to find data for a frequency table. Students use the given link to make a pie graph...
Curated OER
Charting and Graphing Sales
Students analyze and represent weekly sales figures using tables, bar graphs, and pie charts. They draw conclusions using bar graphs and pie charts. Students are told that each day at school they have the option of buying or bringing a...
Curated OER
What Pie?
Students practice making and interpreting pie graphs so they are better able to decide if a pie chart is the appropriate form of display. Students examine included overheads of different pie charts, and directions on how to make pie...
Curated OER
Pie Chart
In this literacy worksheet, learners use the created resources for further progress towards knowledge. The sheet is a teacher's guide for creating student resources.
Curated OER
Mathematics Within: Bar And Pie Graphs
Students compare and contrast the use of bar and pie graphs with the same data. They create a data set by surveying all students in the class using sticky notes to make a table on the board. Then, each student creates a bar and pie graph...
Curated OER
Bar Graphs and Pie Charts
Fourth graders explore their interest and strengths and display them using a bar graph and pie chart.
Curated OER
Musical Genre Pie Charts
In this pie chart worksheet, young scholars transpose musical genre data to the charts and then answer questions about the results.
Curated OER
Creating Pie Graphs Using Percents
Sixth graders examine how to convert fractions to percents and percents to fractions. They list their activities for a 24 hour period, and create a pie graph using Microsoft Works.
Curated OER
Creating Bar Graphs and Pie Graphs
Second graders observe a demonstration of the creation of a bar graph and a pie graph of their favorite colors. They gather information about various topics from their classmates, then organize the information, creating a bar and a pie...
Other popular searches
- Pie Charts and Graphs
- Line Pie Bar Graph
- Circle Graphs Pie Charts
- Bar Graphs, Pie Charts
- Paper Pie Chart/graph
- Graphing Pie Charts
- Bar Graphs Pie Charts
- Bar Graphs and Pie Charts
- Pie Charts Graphs
- Pie Chart Circle Graph
- Pie Chart Graphs


