College Board
2003 AP® Statistics Free-Response Questions Form B
Update the statistics in your course using older AP® questions. The 2003 AP® Statistics free-response questions cover several of the concepts in the current statistics standards for all pupils. Items contain questions about determining...
College Board
2004 AP® Statistics Free-Response Questions Form B
Over the years, data analysis has been important. Looking back to the 2004 AP® Statistics Form B free-response questions, pupils and teachers see the importance of analysis of data sets. The six questions contain analysis of data on...
Rice University
Introductory Statistics
Statistically speaking, the content covers several grades. Featuring all of the statistics typically covered in a college-level Statistics course, the expansive content spans from sixth grade on up to high school. Material comes from a...
Radford University
Danger! – An Analysis of the Death Toll of Natural Disasters
Decipher the danger of natural disasters. Using researched data, scholars work in groups to create data displays on the number of deaths from different types of natural disasters. They share their graphical representations with the class...
Radford University
Let's Buy a Car
Ready to buy a car? Learners research different makes and models of cars to decide on the best one to buy. They collect data on cost, fuel efficiency, safety ratings, and insurance costs, then create and analyze data displays to make...
Radford University
Box-and-Whisker Activity
Think inside the box. Working in small groups, pupils design a study to answer comparing two data sets. Team members collect data and construct box-and-whisker plots and analyze them to prove or disprove their hypothesis. They develop...
US Department of Commerce
Census in Counties - Describing and Comparing Histograms to Understand American Life
Use graphs to interpret life in 136 counties. Pupils analyze histograms and describe the shapes of the distributions of data collected from several counties on different aspects of life. Scholars make predictions on the difference in...
US Department of Commerce
Does the Percentage of People Who Walk to Work in Cities Vary with Population Size?
To walk or not to walk? Pupils create box plots comparing the percentage of residents who walk to work in large, medium, and small cities. Using the box plots, class members compare the data that reflects available statistics. Scholars...
Flipped Math
Unit 4 Review: One Variable Statistics
It's always nice to slow down and review. Scholars work on problems covering concepts on one-variable statistics. They create and interpret box plots and stem-and-leaf plots, determine the mean, median, mode, interquartile range, and...
Workforce Solutions
30 Seconds
Thirty seconds are all scholars have to develop an engaging commercial to showcase their talents and experience within a specific occupation. Pairs work collaboratively to keep each other on time to deliver information speedily and ask...
American Statistical Association
A Tale of One City and Two Lead Measurements
Lead the way in learning about lead contamination. Pupils first read several articles about the Flint water crisis and the EPA's rules for lead concentration. They use provided data from 71 Flint water wells to compute the 90th...
Curated OER
Scatterplots and Regressions
In this scatterplots and regressions worksheet, students solve 6 different types of problems related to graphing scatterplots and interpreting regressions. First, they create a scatterplot from the given data coordinates and then,...
Curated OER
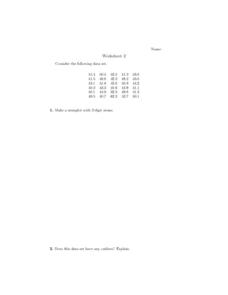
Median and Mode
In this median/mode worksheet, students solve 6 problems, using a table of students and their heights in centimeters. Students find median, mode, outliers and arrange data from least to greatest.
Curated OER
Normal Probability Plot
Students analyze the graph of a distribution. In this statistics lesson, students define skewed or mound shape distribution as they investigate the data behind the graph. They define and plot outlier as well as normal probability.
Curated OER
Stemplots
In this stem plot instructional activity, students construct 3 stem plots. Students answer 1 question about outliers and another question regarding which stem plot is preferred.
Curated OER
Explanatory and Response Variables
In this explanatory and response variables worksheet, students answer 4 problems surrounding variable relationships and outliers. Student must construct a scatter plot.
Curated OER
Boxplots Introduction
Students describe the pattern of a bell curve graph. In this statistics lesson, students move data around and make observation about the mean, and the quartiles. They define boxplot, outlier, range and other important vocabulary words...
Curated OER
Mean, Median and Mode
Students define mean, median, mode and outliers. In this statistics lesson, students analyze data using the central tendencies. They follow a path through a maze collecting data. They analyze the data using the mean, median and mode.
Curated OER
Shut it Off!
Students identify the central tendencies. In this statistics lesson, students find the mean, median and mode of their collected data. They explain the effect of outliers on the data.
Curated OER
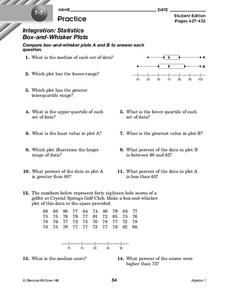
Box-and-Whisker Plots
In this box-and-whisker plots worksheet, 9th graders solve and complete 14 different problems that include comparing various box-and-whisker plots. First, they determine the median for each set of data and plot the lesser range. Then,...
Kenan Fellows
Reaction Stoichiometry—How Can We Make Chalk?
What is a reasonable percent yield in the manufacturing process? Scholars develop a process for producing chalk in the third lesson of a six-part series. Then, they must determine the theoretical and percent yield. Discussions about...
Curated OER
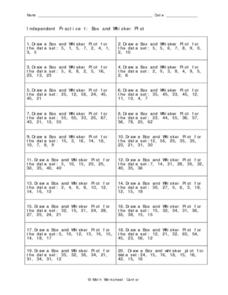
Independent Practice 1: Box and Whisker Plot
In this box and whisker plot worksheet, students create a box and whisker plot from a given set of data. They identify the lower quartile, upper quartile, the mean, and outliers. This one-page worksheet contains 20 sets of numbers from...
Curated OER
Business & Statistics: Final Exam
In this business and statistics worksheet, students read real-life business problems, arrange data, and identify the probability method best used to determine the answer. They identify the type of random sample, draw stem-and-leaf plots,...
Curated OER
Midterm 1 Exam: Statistics
In this statistics worksheet, students determine the mean, variance, standard deviation and median of given statistical data. They organize data, create box-and-whisker plots and identify outliers. This nine-page worksheet contains 7...
Other popular searches
- Line Plot Outliers
- Outliers Box Plots
- Gaps,clusters, Outliers
- Outliers and Data
- Outliers Interquartile Range
- Mean, Median, Mode Outlier
- Clusters and Outliers
- Range and Outliers
- Outliers Boxplots
- Mean Median Mode Outliers
- How Outliers Affect Mean
- Gapsclusters Outliers


