EngageNY
Percent and Rates per 100
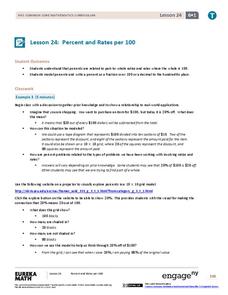
What percentage of your class understands percents? Pupils learn the meaning of percents based upon rates per 100 in the 24th lesson in a series of 29. They represent percents as fractions, decimals, ratios, and models. The scholars...
Curated OER
Multiplication Five Minute Frenzy Charts (B)
In this multiplication facts worksheet, students complete four 10 by 10 grid charts with multiplication facts to 144. Students try to complete each chart in less than five minutes and score 98% or better.
Curated OER
Multiplication Five Minute Frenzy Charts (C)
In this multiplication facts worksheet, students complete four 10 by 10 grid charts with multiplication facts to 144. Students try to complete each chart in less than five minutes and score 98% or better.
Curated OER
Five Minute Frenzy Charts (D)
In this multiplication facts instructional activity, students complete four 10 by 10 grid charts with multiplication facts to 144. Students try to complete each chart in less than five minutes and score 98% or better.
Curated OER
Multiplication Five Minute Frenzy (A)
In this multiplication worksheet, students fill out four 10 by 10 grids. Students write the product of the column number and the row number. Students try to complete each chart in less than 5 minutes and score 98% or better.
National Math + Science Initative
Introduction to Decimals
Three activities make up an introductory lesson designed to create a strong foundation in comparing fractions to decimals and exploring and building decimal models. Pupils brainstorm and complete a Venn diagram to show how decimals and...
Curated OER
Multiplication Matrix
For this finding the products worksheet, students solve multiplication facts to fill in the blanks in the twelve by twelve grid. Students solve 144 problems.
Mathematics Assessment Project
Printing Tickets
That's the ticket! Pupils write and investigate two linear functions representing the cost of printing tickets. Individuals then determine which of two printing companies would be a better buy.
Los Angeles County Office of Education
Assessment for the California Mathematics Standards Grade 5
Test young mathematicians' knowledge with an assessment aligned to California's fifth grade state standards. The exam covers a multitude of concepts including fractions and decimals, positive and negative numbers, measurement; and...
EngageNY
Solving Percent Problems III
What happens when combining percentage discounts? The last lesson in a series of 29 introduces the idea of combining discounts one after another. Pupils wrestle with the claim that to find the total discount, they need to only add...
Curated OER
Tenths and Hundredths practice 21.1
In this identifying tenths and hundredths worksheet, students write fractions and decimals describing models, use grid paper to draw models of fractions and decimals, convert them, and answer word problems. Students answer twenty-two...
Curated OER
The Histogram
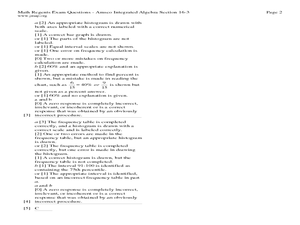
In this Algebra I/Algebra II instructional activity, learners construct and analyze histograms to develop a visual impression of the distributions of data. The two page instructional activity contains five problems. Answer...
Curated OER
Special Segments in a Triangle
In this geometry worksheet, 10th graders review the vocabulary associated with the special segments of a triangle and the associated points of concurrency and solve problems in which they find the indicated missing angle or...
Curated OER
SAT Prep
In this secondary mathematics learning exercise, students are provided with questions that are designed to provide SAT test preparation. The one page interactive learning exercise contains ten questions. Answers are not provided.
EngageNY
A Fraction as a Percent
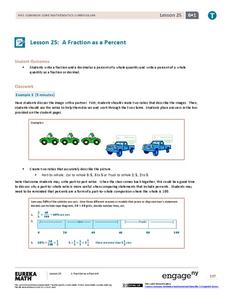
It is all about being equivalent. Class members convert between fractions, decimals, and percents. By using visual models, scholars verify their conversions in the 25th portion of a 29-part series.
Curated OER
Relating Fractions and Decimals
In this fractions and decimals worksheet, students solve 11 problems. Students convert fractions to decimals and write shaded grids as fractions and decimals to the hundredth place.
Curated OER
Decimal Designs
In this decimals worksheet, students evaluate a set of 100 small cubes, some of which are shaded and some which are not. They then answer the first 6 questions by writing the decimal for the shaded and unshaded regions on the spaces...
Mathed Up!
Histograms
Class members explore how to read and use histograms by watching a video on creating and analyzing histograms. To finish, the class works on a set of questions that tests these skills.
Mathematics Assessment Project
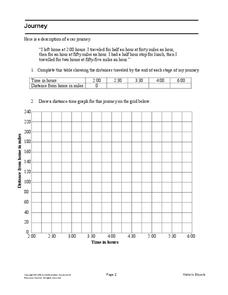
Journey
Drive home math concepts with an engaging task. Learners follow a verbal description to fill in a table and create a distance-time graph representing a car journey. They then answer questions by interpreting the graph.
Curated OER
Hands On: Model Percent
In this model percents practice instructional activity, students sharpen their problem solving skills as they solve 6 story problems.
Curated OER
Math Assessment
In this math activity, students complete the test that focuses upon the skills of completing basic calculations, fractions, and percentages.
