Curated OER
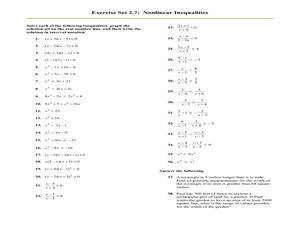
Nonlinear Inequalities
In this Algebra II worksheet, 11th graders solve nonlinear inequalities, graph the solution set on the number line, and write the solution in interval notation. The one page worksheet contains thirty-eight problems. Answers are provided.
Virginia Department of Education
Nonlinear Systems of Equations
Explore nonlinear systems through graphs and algebra. High schoolers begin by examining the different types of quadratic functions and their possible intersections. They then use algebraic methods to solve systems containing various...
EngageNY
Solution Sets to Inequalities with Two Variables
What better way to learn graphing inequalities than through discovering your own method! Class members use a discovery approach to finding solutions to inequalities by following steps that lead them through the process and even include...
EngageNY
More Examples of Functions
Discrete or not discrete? Individuals learn about the difference between discrete and non-discrete functions in the fourth installment of a 12-part module. They classify some examples of functions as being either discrete or non-discrete.
Curated OER
Sloping and Intersecting a Linear Function
Students examine and discuss typical linear equations, and the difference between a linear and nonlinear equation. They observe examples of linear equations and complete a worksheet.
Mathematics Assessment Project
Building and Solving Linear Equations
Young scholars write and solve linear equations in one variable based on descriptions of the operations that are applied to the unknown variable in an algebra machine. They then create their own problems for classmates to solve.
Curated OER
Lessen the Loan
Middle-schoolers explore the concept linear equations. They use the internet to navigate through videos and problems. Pupils problem solve to determine rates of change, slope, and x and y-intercepts.
EngageNY
Linear Systems in Three Variables
Put all that algebra learning to use! Using algebraic strategies, learners solve three-variable systems. They then use the three-variable systems to write a quadratic equation given three points on the parabola.
Curated OER
Make a Math Mascot
Create a math mascot by identifying irrational and rational numbers. Learners will also solve linear equations.
Curated OER
Make a Pass at Me
Learners identify different types of functions and units of measurements. In this statistics lesson plan, students will collect data, graph their data and make predictions about their data. They plot a linear regression graph.
Shodor Education Foundation
InteGreat
Hands-on investigation of Riemann sums becomes possible without intensive arithmetic gymnastics with this interactive lesson plan. Learners manipulate online graphing tools to develop and test theories about right, left, and midpoint...
Curated OER
Show Me the Money
Pupils investigate financial applications of mathematics in this mathematics instructional activity. They will investigate equations that represent a company’s income, expense, and profit functions and use those equations to identify...
American Statistical Association
Scatter It! (Predict Billy’s Height)
How do doctors predict a child's future height? Scholars use one case study to determine the height of a child two years into the future. They graph the given data, determine the line of best fit, and use that to estimate the height in...
Pennsylvania Department of Education
Alike and Different
Students compare and contrast objects and are introduced to a Venn Diagram. In this alike and different lesson, students make observations regarding properties of objects. Students classify object and build ideas about variables....
Curated OER
Between The Extremes
Students analyze graphs for specific properties. In this algebra lesson, students solve equations and graph using the TI calculator. They find the different changes that occur in each graph,including maximum and minimum.
Curated OER
What Are The Chances
Students calculate the probability of an event occurring. In this probability lesson, students differentiate between independent, dependent or compound events. They find the range of the data.
Curated OER
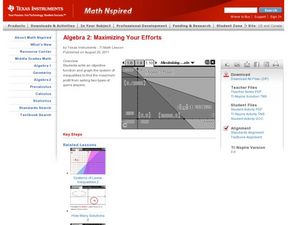
Maximizing Your Efforts
Young scholars graph systems of equation. In this algebra lesson, students find where the lines cross and identify the type of solution. They analyze a graph and write the equation of the line.


