CK-12 Foundation
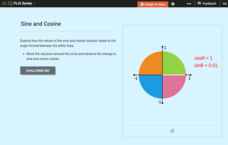
Domain, Range, and Signs of Trigonometric Functions: Sine and Cosine
Is there a relationship between the sign of sine and cosine and the angle on the unit circle? Scholars use an interactive to see the value of sine and cosine within different quadrants. they then use the information to determine the...
Curated OER
Beyond Averages: Median, Mode and Range
For this median, mode and range worksheet, students complete a set of 10 multiple choice questions, clicking on an answer link to view correct answers.
CK-12 Foundation
Restricted Domain and Range: Restricted Circle Radius and Area
There's no restriction to how much your class can learn about domain and range. Users of an interactive adjust the radius of a circle to see its effects on the area. They note how restrictions in the domain (radius) relate to...
CK-12 Foundation
Restricted Domain and Range: Translation of a Curve
Moving the graph of a function obviously changes its domain and range. Scholars adjust the location of a graph in an interactive coordinate plane. The interactive automatically updates and displays the domain and range to show how it...
CK-12 Foundation
Domain and Range of a Function: Making Money Math
Graphs are useful for many things, including seeing how much money you can make. Individuals create a graph of earnings from a job based on the number of hours. They determine the domain and range of the graph and answer challenge...
Shodor Education Foundation
Plop It!
Build upon and stack up data to get the complete picture. Using the applet, pupils build bar graphs. As the bar graph builds, the interactive graphically displays the mean, median, and mode. Learners finish by exploring the changes in...
CK-12 Foundation
Linear and Non-Linear Function Distinction: Domain and Range of a Function
Functions are special types of relations, but what makes them so special? Pupils use an interactive to slide a vertical line across six different graphs. Ten challenge questions then assess understanding of functions.
Curated OER
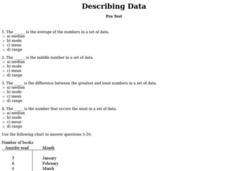
Describing Data
In this data worksheet, students complete multiple choice questions about mean, median, mode, and range. Students complete 10 questions total.
Curated OER
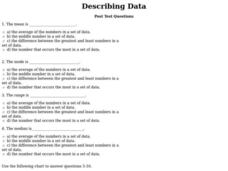
Describing Data
In this describing data worksheet, students answer multiple choice questions about mean, median, mode, and range. Students complete 10 questions total.
CK-12 Foundation
Displaying Univariate Data: Ordering Leaves
Leaf a little time to organize data. Given data displayed in a stem-and-leaf plot, learners organize the data in a list. Pupils use the data to determine the mode, median, and range of the data set. They determine the benefits of using a...
CK-12 Foundation
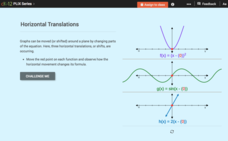
Horizontal Translations or Phase Shifts: Horizontal Translations
Find out what causes a function to slide. Pupils move a function along the x-axis and see the resulting change in its equation. Scholars determine the effects that the translation has on the intercepts, domain, and range of the function.
Shodor Education Foundation
Measures
Take a look at data from a statistical lens. An interactive allows pupils to enter data set, labeling the data including the units used. Manipulating the applet, learners select the statistics to calculate that include total, mean,...
CK-12 Foundation
Frequency Polygons: Constructing a Frequency Polygon
Connect the dots on frequency. Given a distribution table of scores on an assessment, learners create a frequency polygon by moving points on a graph to the correct frequency. The pupils use the display to answer questions about the...
CK-12 Foundation
Understand and Create Histograms: Histograms
Determine the shape of weight. Using the interactive, class members build a histogram displaying weight ranges collected in a P.E. class. Scholars describe the shape of the histogram and determine which measure of central tendency to use...
Physics Classroom
Color Pigments
Objects contain pigments that selectively absorb a wavelength of light, and our eyes only observe a very small range of these wavelengths. Scholars apply these two facts to three different activities. They identify the pigment in an...
CK-12 Foundation
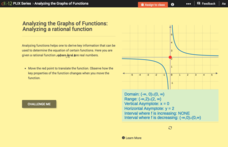
Analyzing the Graphs of Functions: Analyzing a Rational Function
Shift the function and transform the key features of the graph. By translating the graph of the rational function, class members find out how the key features alter. Pupils determine the domain, range, asymptotes, and intervals of...
Curated OER
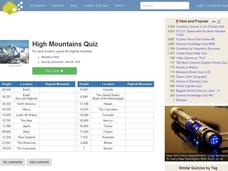
High Mountains Quiz
In this online interactive geography quiz learning exercise, students respond to 18 identification questions about the highest mountain ranges in the world. Students have 4 minutes to complete the quiz.
CK-12 Foundation
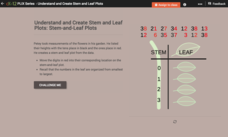
Understand and Create Stem-and-Leaf Plots: Stem-and-Leaf Plots
Explore the advantages to using a stem-and-leaf plot using an online lesson. Learners manipulate an animation to create a stem-and-leaf plot. They then calculate statistics for the data using their display. Guiding questions help them...
Scholastic
Study Jams! Line Plots
Data analysts are guided through the arrangement of whole-number data onto a line plot by listening and viewing a high-quality, animated, and narrated set of slides.
ABCya
Ab Cya: It's Glow Time Mean, Median, Mode, & Range
Want to have fun while learning Mean, Median, Mode, and Range? Well... It's Glow Time! In this game kids can play a favorite arcade game to earn tickets and points, and then analyze the data. Type in the correct answers to enter Free...
Calculator Soup
Calculator Soup: Mean, Median, Mode Calculator
Calculate mean, median, mode along with the minimum, maximum, range, count, and sum for a set of data.
Calculator Soup
Calculator Soup: Descriptive Statistics Calculator
This is a statistics calculator; enter a data set and hit calculate. Descriptive statistics summarize certain aspects of a data set or a population using numeric calculations. Examples of descriptive statistics include: mean, average,...
Concord Consortium
Seeing Math: Plop It
Plop It! lets you experiment with the concepts of mean, median, and mode (measures of center). You see the differences among them on a bar graph, as you add or remove blocks to an axis with a given range.
Calculator Soup
Calculator Soup: Statistics Calculator
Calculate basic summary statistics for a sample or population data set including minimum, maximum, range, sum, count, mean, median, mode, standard deviation and variance.
Other popular searches
- Mean Median Mode Range
- Mean, Median, Mode Range
- Mean, Median, Mode, Range
- Median Mode Range
- Mean Median Mode and Range
- Range, Mean, Median, Mode
- Mean, Median, Mode, and Range
- Median Mode and Range
- Mean, Median, Mode and Range
- Median, Mode, Range
