Curated OER
Estimating the Mean State Area
Seventh grade statisticians randomly select five states and then determine the mean area. The class then works together to create a dot plot of their results.
Mathematics Assessment Project
Mean, Median, Mode, and Range
What a find! Here is a instructional activity, designed to meet sixth grade math Common Core standards, that focuses on the calculation of different measures of center for the scores from a penalty shoot-out competition. An independent...
Florida Center for Reading Research
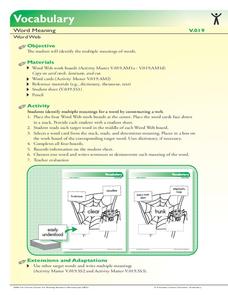
Vocabulary: Word Meaning, Word Web
Explore the multiple meanings of common homographs with this fun language arts activity. Given a series of word webs and a pile of definition cards, pupils complete each web by matching four different definitions to each target word.
Curated OER
Confidence Intervals: Population Mean; Population standard Deviation Known
In this confidence interval worksheet, students examine a given confidence level and sample data to determine the margin of error, identify a confidence interval, list the mean and give the standard deviation. Students complete seven...
EngageNY
Interpreting the Standard Deviation
Does standard deviation work for non-symmetrical distributions, and what does it mean? Through the use of examples, high schoolers determine the standard deviation of a variety of distributions and interpret its meaning. Problems require...
Curated OER
The Common Core Literacy Standards - Grade 2 Posters
Support second graders with mastering the Common Core using this series of classroom displays. With each English language arts standard rewritten as a We can statement and accompanied by images and examples, this resource provides young...
EngageNY
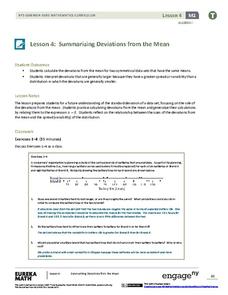
Summarizing Deviations from the Mean
Through a series of problems, learners determine the variability of a data set by looking at the deviations from the mean. Estimating means of larger data sets presented in histograms and providing a way to calculate an estimate round...
Curated OER
Confidence Intervals: Population Mean; Population Standard Deviation Unknown
In this confidence interval worksheet, students examine given statistical information to find the margin of error. They construct a confidence interval for the population and find the mean. Seven statistical problems are available on...
Curated OER
Mean, Median, Mode, etc.
Explore the concept of mean, median, and mode with pupils. They estimate the length of a string or the number of M&M's in a jar. Then find the mean, median, and mode of the class' estimates.
Curated OER
The Common Core Literacy Standards - Grade 3 Posters
Brighten your third grade classroom with this series of colorful Common Core displays. Including all of the English Language Arts standards and substandards, each with supporting illustrations and examples, this resource provides clear...
EngageNY
Mid-Module Assessment Task - Algebra 1 (module 2)
A mid-module assessment uses two multi-part questions to measure progress toward mastery on descriptive statistics standards. Each part of a question addresses a single standard to help determine mastery.
NASET
IEP Goals, & Objectives with Common Core State Standards
Creating IEP goals and aligning those goals with Common Core State Standards just got a whole lot easier. Designed for smart phones and tablets, this resource permits instructors and resource teachers to design programs for individuals,...
CK-12 Foundation
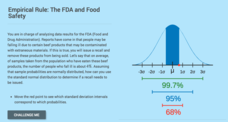
Computing Probabilities for the Standard Normal Distribution: The FDA and Food Safety
To recall or not to recall, that is the question. Using provided data, pupils calculate the percent of people that may fall ill on average. The scholars determine the standard deviation based upon the mean and the empirical rule, then...
Howard Hughes Medical Institute
Spreadsheet Tutorial 3: Column Graphs, Error Bars, and Standard Error of the Mean
There's absolutely no error in using the tutorial! Learners use spreadsheets to create column or bar graphs with error bars. They also learn how to calculate the standard error of the mean in the tutorial. This is the third installment...
Curated OER
Mean and Standard Deviation
Get two activities with one lesson. The first lesson, is appropriate for grades 6-12 and takes about 20 minutes. It introduces the concept of measures of central tendency, primarily the mean, and discusses its uses as well as its...
Curated OER
What's Your Average? What Do You Mean? I'm More Than Just Average
Upper grade and middle schoolers collect data, analyze and interpret the data. This three-part lesson should provide learners with a firm understanding about the differences between mean, median, and mode and how to perform the...
Curated OER
Introduction to Statistics: Mean, Median, and Mode
Students explore the concepts of mean, median, and mode. They develop an understanding and familiarity with these concepts. Students explore mean and median in an efficient way. Students explore three different measures of center.
Curated OER
Mean Absolute Deviation in Dot Plots
The lesson focuses on the ideas of dot plot representations and the mean absolute deviation of data sets.
Curated OER
Statistics: Standard Deviation and Outliers
In this statistics learning exercise, statisticians construct a stem-plot and answer questions regarding the shape of the distribution, standard deviation, and outliers.
Curated OER
Looking at different cultures and how music from differing cultures changes movements, meaning and mood
Each of the three dance lessons included here will get your class moving. The first lesson allows learners to explore how music and movement differ in meaning depending on cultural context. Lesson two gives them an opportunity to create...
EngageNY
Sampling Variability in the Sample Mean (part 2)
Reduce variability for more accurate statistics. Through simulation, learners examine sample data and calculate a sample mean. They understand that increasing the number of samples creates results that are more representative of the...
EngageNY
The Mean Absolute Deviation (MAD)
Is there a way to measure variability? The ninth resource in a series of 22 introduces mean absolute deviation, a measure of variability. Pupils learn how to determine the measure based upon its name, then they use the mean absolute...
Los Angeles County Office of Education
Assessment For The California Mathematics Standards Grade 6
Test your scholars' knowledge of a multitude of concepts with an assessment aligned to the California math standards. Using the exam, class members show what they know about the four operations, positive and negative numbers, statistics...
Curated OER
What Common Core Means for High School Mathematics
Embrace the Common Core standards and experience an exciting transformation of learning in your mathematics classroom.


