Radford University
Sleep and Teen Obesity: Is there a Correlation?
Does the number of calories you eat affect the total time you sleep? Young mathematicians tackle this question by collecting their own data and making comparisons between others in the class through building scatter plots and regression...
EngageNY
More on Modeling Relationships with a Line
How do you create a residual plot? Work as a class and in small groups through the activity in order to learn how to build a residual plot. The activity builds upon previous learning on calculating residuals and serves as a...
Pennsylvania Department of Education
Volume and Surface Area
Build boxes using unit cubes to compare surface area and volume. The group performs multiple experiments to determine properties of volume, such as if it makes a difference which order the dimensions are multiplied in. Extensive...
Kent State University
How Does that Work?
Sixth and seventh graders explore algebra word problems. They work with a partner to solve word problems distributed by e-mail. Learners simplify mathematical expressions following a "think aloud" algebra strategy modeled by the teacher....
Math Warehouse
Theoretical Probability Activity
If you keep rolling a die, you'll roll a five exactly one-sixth of the time—right? A probability lesson prompts young mathematicians to roll a die 100 times and use the data to calculate empirical probabilities. They then compare...
Curated OER
In the Billions and Linear Modeling
Your learners analyze population data to discern if it best fits a linear scenario. The idea of change by equal differences over equal intervals is enforced in this real-life task.
Curated OER
Voter Turnout
Explore politics by analyzing the voting process. Pupils discuss the purpose of casting votes in an election, then examine graphs based on the data from a previously held election's turnout. The activity concludes as they answer study...
Curated OER
US Households
Learners construct and use inverse functions to model a real-world context. They use the inverse function to interpolate a data point.
Curated OER
Go The Distance Car Construction
Students build and program a car to drive a specific challenge distance.They must at the end of the lesson, have the car that stops the closest to a challenge distance.
Curated OER
Skate Party
Learners use the Frayer model during problem solving. In this problem solving instructional activity, they examine multiple methods of data collection to solve real world problems. Resources are provided.
Stats Monkey
Everything I Ever Needed to Learn about AP Statistics I Learned from a Bag of M and M's®
Candy is always a good motivator! Use this collection of M&M's® experiments to introduce statistics topics, including mean, standard deviation, nonlinear transformation, and many more. The use of a hands-on model with...
Curated OER
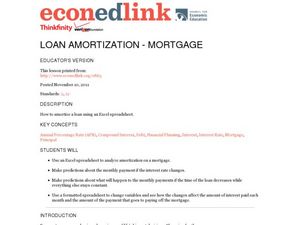
Loan Amortization - Mortgage
Upper graders explore the connection between interest and principal. They use an amortization schedule to determine the amount of principal paid vs interest on a $100,000 home loan. Fourteen discussion questions and a research-based...
Curated OER
Walk-A-Thon
Students graph linear http://www.lessonplanet.com/review?id=180542equations. In this problem solving lesson, students calculate slope and plot ordered pairs on a coordinate grid. Using a real-life example of a walk-a-thon, students...
Illustrative Mathematics
Kimi and Jordan
Kimi and Jordan have taken summer jobs to supplement their weekly allowances. Kimi earns more per hour than Jordan, but Jordan's weekly allowance is greater. This activity asks students to determine how the incomes of the two workers...
Curated OER
TE Activity: A Tornado in My State?
Students study data about tornadoes in the United States while completing a worksheet. They develop a bar graph showing the number of tornadoes for the top ten states in the US. They find the median and mode of the data set.
Curated OER
Let's Plot Points
Use coordinate grid paper to plot points and identify shapes that are already plotted on the paper by saying their coordinates. Pupils also measure the distance between points and play the game Battleship. There are several web links and...
Utah Education Network (UEN)
Probability and Statistics
MAD about statistics? In the seventh chapter of an eight-part seventh-grade workbook series, learners develop probability models and use statistics to draw inferences. In addition, learners play games and conduct experiments to determine...
Curated OER
Buying Cars/Financing Cars Compound Interest
Provide a real world context in which exponential functions are used to determine a eal world phenomena such as compound interest and exponential growth. This instructional activity should be taught after students have mastered the laws...
Curated OER
Stone Soup
Students examine the topics of conflict, resolution, and solution using the book "Stone Soup." They create a class pictograph using real vegetables brought in by the students, answer story comprehension questions, and sequence the events...
Curated OER
Matrix Analysis of Networks
Explore the connection between a finite graph, a directed graph, and a matrix. Graph lines and identify the relationship of matrices in real-world scenarios. Then use this information to work with a partner to plan and design a...
Curated OER
Even/Odds Game
Using a game format, learners review what they know about theoretical probability. As they roll tetrahedron dice, they record their results as odd or even. Afterwards, they discuss their findings.
Curated OER
What Contains Carbon?
Students explore elements by analyzing everyday objects and materials in class. For this carbon lesson, students define several vocabulary terms such as carbon dioxide, hydrocarbon, and carbonate. Students view a group of items,...
Ohio Literacy Resource Center
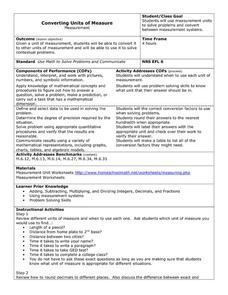
Converting Units of Measure
Follow six steps to implement this series of metric worksheets. Here, mathematicians exhibit their knowledge of problem solving, while converting units of measurement and label their answers with the applicable unit name.
Curated OER
Seized Before Flights: Graph
In this bar graph worksheet, students analyze a graph that show the number of prohibited items intercepted at U.S. airport screening checkpoints. Students answer 3 problem solving questions about the data on the graph.


