Curated OER
Divide and Conquer: Division Rules
In this division rules instructional activity, students name the division rules used in a set of tables, then fill in missing input and output numbers to complete, 4 tables total.
Curated OER
Guess My Rule (Function Tables)
Seventh graders recognize and solve functions. To reinforce the solving of word problems, 7th graders play a guessing game where they try to identify the functions used. They complete worksheets and draw graphs to match the problem in...
Curated OER
Variables and Patterns: Determining an appropriate scale while graphing
Sixth graders determine appropriate scales when graphing data. For this graphing lesson, 6th graders use an the applet "Graph It" to determine what is an appropriate scale for their data.
Curated OER
Math Maven's Mysteries
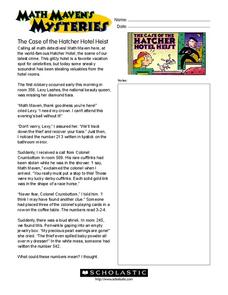
In these story problem worksheets, learners read the story problem 'The Case of the Hatcher Hotel Heist' and use the information within the story to help them solve the problem. Students use addition and subtraction to find the next room...
Curated OER
Genetics
Trace simple genetic patterns of inheritance through a small population. Your students create a family pedigree that traces a genetic condition through several generations.
Curated OER
The Yo-Yo Problem: Solving Linear Equations
Learners write the algebraic equation to determine the number of weeks money must be saved to purchase a yo-yo. In this algebra lesson, students create a pattern of one penny surrounded by six pennies. They continue the pattern and...
Curated OER
Estimating Products with Decimal Movement
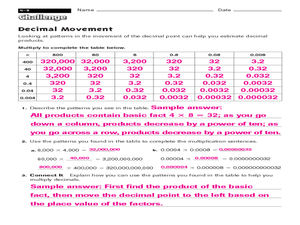
In this estimating products with decimal movement instructional activity, 5th graders multiply to complete the table, then answer three questions about the patterns in the movement of the decimal point.
Inside Mathematics
House Prices
Mortgages, payments, and wages correlate with each other. The short assessment presents scatter plots for young mathematicians to interpret. Class members interpret the scatter plots of price versus payment and wage versus payment for...
Inside Mathematics
Snakes
Get a line on the snakes. The assessment task requires the class to determine the species of unknown snakes based upon collected data. Individuals analyze two scatter plots and determine the most likely species for five...
Virginia Department of Education
Matching Representations
Pupils explore the many representations of linear functions by completing a matching activity to connect the multiple representations of a function. They then reinforce the connection as individuals create the different representations...
Houghton Mifflin Harcourt
Developing the Concept: Multiplying and Dividing with Negative Integers
Show your math class strategy charts that will help them solve multiplication and division problems using both positive and negative integers. This resource gives you questions to ask as you guide learners through the concepts. Have them...
Curated OER
Investigating the Relationship Between Slope and Angles
In this slope angles instructional activity, learners discover the relationship between slope and angle. Students complete tables of values and answer four discussion questions.
Inside Mathematics
Graphs (2004)
Show your pupils that perimeter is linear and area is quadratic in nature with a short assessment task that requests learners to connect the graph and equation to a description about perimeter or area. Scholars then provide a...
Virginia Department of Education
Independent and Dependent Variables
Investigate the relationship between independent and dependent variables. Individuals begin by identifying independent and dependent variables from different problem situations. Then, using specific guidelines, they create posters...
Curated OER
The Squares of Numbers in Multiplication
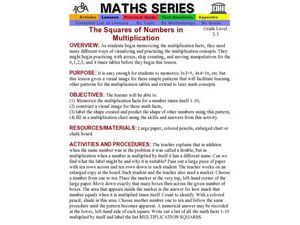
Young scholars make multiplication squares. In this math lesson, students review their multiplication facts and multiplication strategies. Young scholars are introduced to multiplication squares when multiplying a number by itself.
Curated OER
Platonic Solids
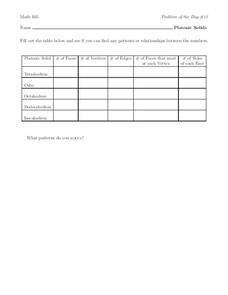
A chart in this activity prompts students to list the number of faces, vertices, and edges in each of five shapes. Additionally, students provide the number of faces that meet at each vertex as well as the number of sides of each face....
Curated OER
Learning the Anti-differentiation Process
In this math worksheet, students examine the data table and attempt to fill in the empty boxes for the functions. They are asked to list the pattern found there.
Curated OER
Discovering Euler's Theorem
Learners identify different parts of a prism and polyhedra. For this geometry lesson, students identify the number of faces, edges and sides of polygons. They solve problems by recognizing patterns.
Curated OER
Counting Patterns - Count Forward by 3 Up to 100
In this counting pattern worksheet, 3rd graders count forward by 3 in each number sequence. They fill in 3 tables using the counting by 3 pattern. They start with both odd and even numbers.
Curated OER
Sequences and Linear Equations
Students identify the formula to find the nth term. In this algebra lesson, students finish a pattern and identify missing parts in a sequence. They write an equation given a partial sequence.
Curated OER
Fractals Rock
Students identify the repeated sequences of a pattern. In this geometry lesson, students identify fractals in patterns and nature. They construct a fractal tree and make conjectures.
Curated OER
Two for One Box Company
Students draw a net (a two-dimensional pattern that can be formed to make a solid) for making an open top box on grid paper. They cut out the net and fold up each side to form the open box and tape the sides, then find the volume of the...
Curated OER
Triangular Numbers
In this triangular numbers worksheet, students create a table of triangular numbers, write a formula for the nth number, and determine the sum of any two consecutive triangular numbers. This two-page worksheet contains five problems.
Curated OER
Family Vacation
Students use math to plan a trip by houseboat down the Mississippi River. They research and obtain information on the Mississippi River and its surroundings and use multiple graphs to represent their data.


