Curated OER
Lesson 6-7: Scatter Plots and Equations of Lines
In this scatter plot worksheet, students examine tables and write a linear equation that matches the table. Students graph linear equations. They read scatter plots, determine the trend line, and write a linear equation to...
Curated OER
Line Graphs
For this line graphing worksheet, learners read a table showing items four children "posses" and plot graphs for each child showing the distribution of objects they each have. Students plot four line graphs.
Curated OER
Graphing Linear Equations
In this calculator active graphing worksheet, students graph 12 equations via a calculator and transfer the graphs onto coordinate grids.
Curated OER
Graphs of Functions
In this using function tables to problem solve worksheet, students interpret and complete function tables to solve problems. Students solve six word problems.
Curated OER
Shaquille O'Neal Hand & Foot Span
If Shaquille O'Neal wears a size-20 shoe, how big are his hands? Learners will use the average ratios of foot length to hand span to calculate the hand span of Shaq, but first, they have to collect the data! They will...
Curated OER
Graph Functions with Integers
Fifth graders can do a quick review of graphing functions using integers with this worksheet. The worksheet has questions which require students to identify the pertinent information in a word problem, and create a graph to represent the...
University of Utah
Functions
Define, explore, compare, and analyze functions with the fourth chapter of a 10-part eighth-grade workbook series. After encountering the definition of a function, pupils begin to explore linear and nonlinear functions. They then...
EngageNY
Properties of Trigonometric Functions
Given a value of one trigonometric function, it is easy to determine others. Learners use the periodicity of trigonometric functions to develop properties. After studying the graphs of sine, cosine, and tangent, the lesson connects...
Balanced Assessment
Melons and Melon Juice
Model the difference between the graphs of discrete and continuous functions. Scholars examine two scenarios and construct graphs to model the situation. They then compare their graphs that illustrate the subtle difference between these...
Flipped Math
Calculus AB/BC Mid-Unit 1 Review: Limits
Limit the amount one forgets about limits. A mid-unit review lesson has individuals complete a activity of problems on limits. They go over the meaning of limits, evaluate limits algebraically, use graphs and tables to find limits, and...
California Mathematics Project
Viral Marketing
Math's gone viral—in the form of an exponential function! The activity uses an exponential function to model the growth of a marketing strategy. Learners create a table of values to observe the pattern in the numbers and then model the...
Curated OER
Art Class, Variation 1
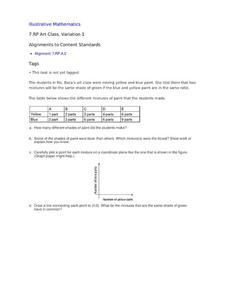
Student statisticians calculate ratios to determine how many shades of green were mixed by Ms. Baca's art class. They graph the number of blue parts against the number of yellow parts for each combination and discover that some produce...
Curated OER
Topic 3.5 & 3.6: Linear Programming
In this linear programming worksheet, students define variables and write a system of inequalities for the given situation. They model the solution through graphing. This two-page worksheet contains six multi-step word problems.
Curated OER
Worksheet 10: Continuous Functions
In this math worksheet, students answer 7 questions regarding continuous functions, domains, differentiables, and inverse functions.
Curated OER
Problem Solving: Break a Problem into Parts
Learners work with the strategy of breaking a problem into parts in order to solve it. They write an expression with parentheses for each of the first three problems, and solve the problem, and use information from a table to answer the...
Curated OER
Cricket Weather
In this collecting data worksheet, 4th graders use the data collected on crickets chirps and the temperature to make a line graph by following 4 directives.
Curated OER
Problem-Solving Application: Use a Graph
In this problem solving activity, 6th graders use the problem solving steps of understand, plan, solve and look back to answer a graphing question.
Curated OER
Line Graphs
In this line graphs instructional activity, 8th graders solve and complete 10 different problems that include various line graphs. First, they use each line graph shown to respond to the questions that follow regarding books and...
Curated OER
Problem-Solving Application: Use a Graph: Problem Solving
In this graph usage activity, students read the word problem and then learn to use a math graph by following the steps of understand, plan, solve, and look back.
Curated OER
Creating Frequency Tables
In this frequency table worksheet, learners explore a given set of numbers. They group the data and create a frequency table. This one-page worksheet contains ten problems.
Curated OER
Reading Frequency Tables
In this data interpretation learning exercise, students record the data from 10 examples into frequency tables. They group 10 more data sets, and make a frequency table for each.
Curated OER
Frequency Tables and Histograms
In this graph worksheet, 5th graders study the data presented on a bar graph. Students then respond to 4 short answer questions using the information that has been provided.
Curated OER
Line and Double Line Graphs: Reteach
In this graphing worksheet, students review the five steps for making a double line graph to display data. Students then use the graph they made following the shapes to answer the three questions.
Curated OER
Make and Read Bar Graphs
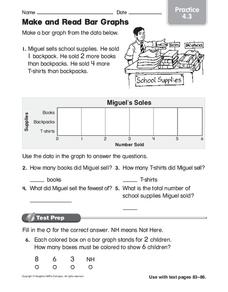
In this bar graphs worksheet, learners make a bar graph about the sale of school supplies with the data presented in one story problem.


