Curated OER
Fire!, Probability, and Chaos
Students explore the concept of probability. In this probability lesson, students simulate a controlled forest burn using an applet. Students vary the probability of trees burning and predict what will happen.
Curated OER
Box Plots on the TI-83 Calculator
Eighth graders research box plots on the Internet. They gather real life statistics and analyze the collected statistics by making multiple box plots on the TI-83 calculator.
Curated OER
Whirlybirds
Students measure to the nearest centimeter, and predict the frequency of an event. For this statistics lesson, students participate in a simulation of a parachute jump competition by making paper Whirlybirds, and then dropping them...
Curated OER
Hare and Tortoise Game
Students participate in the Hare and Tortoise Game and the "Castle Warwick" problem (from an Addison Wesley text). They use the computer to practice resampling statistics and explore different approaches to their tasks. They present th
Curated OER
Probability and Sports
Students research topics on the internet where probability is relevant. Students study statistics and probability concepts by looking at practical questions that arise in professional sports.
Curated OER
Scale Me Down
Students create scale drawings, and ultimately scale models, of real-world objects in this Math activity about ratios, proportion, scaling factors, and cross products. The activity includes ideas for cross-curricular extensions and is...
Curated OER
Will Exams Be Cancelled?
If the flu outbreak continues, exams will have to be canceled. Investigate the properties of exponential and logarithmic functions. In this algebra instructional activity, young scholars use the TI to examine and differentiate between...
Pennsylvania Department of Education
Equally Likely and Unequally Likely Outcomes
Students explore probability. In this statistics/probability lesson, students compare experimental and theoretical probability and use experimental probability to make predictions and conjectures. Students explore the...
Curated OER
Geometric Probablitiy: Spinners and Dartboards
Slearners explore and analyze the properties of geometric areas. In this geometry lesson, sstudents use technology to simulate spinners and dartboards in order to fing areas of circles and sectors of circles and compare and...
Curated OER
Antacid Tablet Race
Young scholars complete experiments to determine how rocket fuel is affected by surface area and temperature. They compare the reaction rates of antacid tablets. They discuss their results to complete the lesson.
Statistics Education Web
Odd or Even? The Addition and Complement Principles of Probability
Odd or even—fifty-fifty chance? Pupils first conduct an experiment rolling a pair of dice to generate data in a probability lesson. It goes on to introduce mutually exclusive and non-mutually exclusive events, and how to use the...
EngageNY
Sampling Variability in the Sample Proportion (part 1)
Increase your sample and increase your accuracy! Scholars complete an activity that compares sample size to variability in results. Learners realize that the greater the sample size, the smaller the range in the distribution of sample...
Statistics Education Web
The Egg Roulette Game
Hard boiled or raw? Which egg will you get? A hands-on activity has scholars explore the impact of conditional probability. Based on a skit from the Tonight Show, pupils model the selection of the two types of eggs using beads. They...
Statistics Education Web
Which Hand Rules?
Reaction rates vary between your dominant and nondominant hand ... or do they? Young scholars conduct an experiment collecting data to answer just that. After collecting data, they calculate the p-value to determine if the difference is...
American Statistical Association
What is the Probability of “Pigging Out”
Learners apply their understanding of luck to a probability experiment. They play a game of Pass the Pigs to determine the probability of a specific outcome. Using analysis for their data, pupils declare the measures of center, dot...
American Statistical Association
Exploring Geometric Probabilities with Buffon’s Coin Problem
Scholars create and perform experiments attempting to answer Buffon's Coin problem. They discover the relationships between geometry and probability, empirical and theoretical probabilities, and area of a circle and square.
Annenberg Foundation
Skeeters Are Overrunning the World
Skeeters are used to model linear and exponential population growth in a wonderfully organized lesson plan including teachers' and students' notes, an assignment, graphs, tables, and equations. Filled with constant deep-reaching...
EngageNY
Margin of Error When Estimating a Population Proportion (part 1)
Use the power of mathematics to find the number of red chips in a bag — it's a little like magic! The activity asks learners to collect data to determine the percentage of red chips in a bag. They calculate the margin of error and...
Curated OER
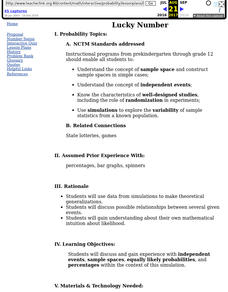
Lucky Number
Students use data from simulations to make theoretical generalizations. They discuss possible relationships between several given events and gain understanding about their own mathematical intuition about likelihood.
Curated OER
Seeing Is Believing
Students investigate the concepts of probability. They use data to find the central tendency, median, and mode. Students design and play a game in order to practice the concepts. They also complete a table with data that is analyzed.
Curated OER
Fire!, Probability, and Chaos
Upper elementary and middle schoolers work with the concept of probability. They are introduced to the concept of chaos. Learners graph and analyze using a line plot, work with mean, and are introduced to the concept of variance.
Curated OER
Algebra: Do You See What I See?
Students discover how to find the mean, median, and mode from sets of data. By using statistical techniques such as whisker plots and bar graphs, they display the data gleaned from problems. Individually, students complete projects...
Curated OER
Roulette
Students participate in a simulation activity to help them summarize issues related to health promotion and disease prevention. They see first-hand what their odds are in acquiring HIV.
Curated OER
Heads or Tails
Seventh graders compare experimental and theoretical probabilities. In this comparing experimental and theoretical probabilities lesson, 7th graders discuss the theoretical probability of flipping a coin. Students flip a coin...


