Virginia Department of Education
May I Have Fries with That?
Not all pie graphs are about pies. The class conducts a survey on favorite fast food categories in a lesson on data representation. Pupils use the results to create a circle graph.
Curated OER
Comparing Data on Graph A and Graph B
Second graders gather and graph data. In this graphing lesson, 2nd graders collect data and graph this information using tally charts, bar graphs, pictographs, or tables. They make predictions about the outcomes.
Curated OER
Data! Data! Graph that Data!
Fifth graders create data graphs using Microsoft Excel. For this data collection lesson, 5th graders create and conduct a survey, then use Excel to organize and graph their data.
Curated OER
Important Decisions Don't Just Happen! Using Data to Plan Your Services
Students interpret statistics. In this data lesson, students examine and organize given data. They present the data in a grid format. Using the census data, students determine the best location for a local business.
Curated OER
Dealing With Data
Learners collect, organize, and display data using a bar graph, line graph, pie graph, or picture graph. They write a summary describing the data represented and compare the graph to another graph in the class.
Curated OER
A Statistical Study of the Letters of the Alphabet
Students gather appropriate information for simple statistical analysis. Then they will calculate probability working with a piece of literature that makes this lesson ideal for teaching across the whole curriculum.
Virginia Department of Education
Organizing Topic: Probability
The probability is high learning will occur! A well-designed unit introduces learners to the concepts of independent, dependent, and mutually exclusive events. Using Venn diagrams, the lessons ask learners to analyze many different...
101 Questions
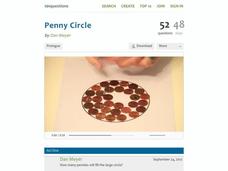
Penny Circle
Watch as your classes buy into a rich lesson full of information. A video opener challenges individuals to determine the number of pennies that fit in a circle with a 22-inch diameter. Using lesson materials, scholars collect data and...
Curated OER
All About Graphs
Students practice organizing data by creating graphs. In this statistics instructional activity, students survey the class about favorite colors and create a bar graph using the data. Students complete a test based on pet and animal...
Curated OER
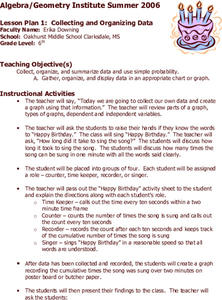
Collecting and Organizing Data
Sixth graders practice collecting and organizing data. In groups, 6th graders determine how many times "Happy Birthday" (at a reasonable rate) may be sung in ten seconds. They collect the information and create a graph.
Curated OER
Twelve Days of Christmas--Prediction, Estimation, Addition, Table and Chart
Scholars explore graphing. They will listen to and sing "The Twelve Days of Christmas" and estimate how many gifts were mentioned in the song. Then complete a data chart representing each gift given in the song. They also construct...
University of Missouri
Money Math
Young mathematicians put their skills to the test in the real world during this four-lesson consumer math unit. Whether they are learning how compound interest can make them millionaires, calculating the cost of remodeling their bedroom,...
Curated OER
Environmental Agents of Mathematics: Mathematics for Change
High schoolers analyze environmental science data using Math. They do research about renewable energy, gather data, create graphs and interpret their findings. Then the group presents their arguments persuasively using their findings to...
Curated OER
Statistics and Probablility
Statistics and Probability are all about collecting, organizing, and interpreting data. Young learners use previously collected data and construct a picture graph of the data on poster board. This stellar lesson should lead to...
Curated OER
A Picture is Worth a Thousand Words
Pupils create various types of graphs. They go to suggested websites to collect data and create graphs to organize the data. Then they answer questions according to their graph.
Statistics Education Web
Now You SeeIt, Now You Don't: Using SeeIt to Compare Stacked Dotplots to Boxplots
How does your data stack up? A hands-on activity asks pupils to collect a set of data by measuring their right-hand reach. Your classes then analyze their data using a free online software program and make conclusions as to the...
Virginia Department of Education
Numbers in a Name
What's in a name? Pupils create a data set from the number of letters in the names of classmates. Each group then takes the data and creates a visual representation, such as a histogram, circle graph, stem-and-leaf plot, etc.
Scholastic
Study Jams! Double-Line Graphs
With two summers of babysitting money, Mia needs a way to compare her earning from both years. Show your learners that they can organize the data onto a double-line graph to easily compare which summer was more profitable. The lesson...
Curated OER
Create Your Own Form
Students gather and organize data using a mock census form, and determine mean, mode, range, and median for sets of data.
National Security Agency
Starting a Restaurant
Through an engaging unit, chefs-in-training will sort and classify data using tally charts. Learners will also create bar graphs to display restaurant data and interpret data from bar graphs using a variety of categories. This is a fun...
Curated OER
State Names: Frequency
Data grathers determine the frequency of specified data. They identify the frequency that specified letters occur in the names of all 50 states. They create stem-and-leaf plots, box-and-whisket plots and historgrams to illustrate the data.
Intel
Track the Trends
Allow your classes to research what interests them. An engaging STEM lesson, the fourth in the series of six, asks individuals to choose a topic of interest and analyze the data through regression models. The regression equations allow...
US Department of Commerce
Applying Correlation Coefficients - Educational Attainment and Unemployment
Correlate education with unemployment rates. Individuals compare state and regional unemployment rates with education levels by calculating the correlation coefficient and analyzing scatter plots. Pupils begin by looking at regional data...
Albert Shanker Institute
Economic Causes of the March on Washington
Money can't buy happiness, but it can put food on the table and pay the bills. The first of a five-lesson unit teaches pupils about the unemployment rate in 1963 and its relationship with the March on Washington. They learn how to create...


