Energy for Keeps
Going for a Spin: Making a Model Steam Turbine
Discover the effectiveness of wind, water, and steam as energy sources. The hands-on activity has young scientists create a turbine from common materials. After constructing the turbines, they use wind, water, and steam to turn them and...
Science 4 Inquiry
The Ups and Downs of Populations
As the reality of population decline across many species becomes real, pupils learn about the variables related to changes in populations. They complete a simulation of population changes and graph the results, then discuss limiting...
Longwood University
How Can We Help Maintain Our Water Supply? Conserving Water
Make young citizens aware of their environmental impact early. An inquiry-based lesson helps learners analyze their own water usage patterns and understand the effects of their habits. Individuals look at data to spot trends and see how...
Minnesota Department of Natural Resoures
Minnesota’s Forests
The forests of Minnesota provide middle schoolers with an integrated learning opportunity. They examine the three biomes and their histories, conduct experiments, read stories, and draw pictures. A lovely lesson about trees.
Sea World
Seals, Sea Lions, and Walruses
Learn about the mammals of the sea with a lesson about seals, sea lions, and walruses. Kids study the characteristics of each pinniped with flash cards and information, and then analyze data about elephant seals, measure heat loss...
Fayetteville-Manlius School
Introduction to Chemistry
Hand your incoming scientists a collection of helpful worksheets to introduce them to your chemistry class. The packet addresses exponents, scientific notation, metric conversion, and dimensional analysis.
Curated OER
Water Down the Drain
Did you know that leaky faucets waste $10 million worth of water? Conservationists perform an experiment and draw best-fit lines to explore how the US Geological Society determined this value.
Mathematics Assessment Project
Temperatures
As a middle school assessment task, learners first examine line graphs of monthly temperatures for two locations, and then match box plots to each line plot.
Agriculture in the Classroom
A Rafter of Turkeys
How did that turkey get from the early Aztec culture to your table? Learn about the history of wild and domesticated turkeys in North America, as well as their inclusion in Thanksgiving traditions, with a two-part agricultural science...
Polar Trec
How Much Data is Enough?
The next time you read a magazine or watch the news, make note of how many graphs you see because they are everywhere! Here, scholars collect, enter, and graph data using computers. The graphs are then analyzed to aid in discussion of...
Federal Reserve Bank
Lesson 1: Katrina Strikes
Most families have an emergency kit in their home with flashlights, water, and extra food. But what happens to your money when disaster strikes? An economics lesson focused on the aftermath of Hurricane Katrina in 2005 demonstrates the...
Federal Reserve Bank
Lesson 2: In the Aftermath
Don't wait for a crisis to get your finances together. An economics instructional activity demonstrates the importance of understanding crucial documents, banking basics, and financial tools with the focus on Hurricane Katrina in 2005...
Beyond Benign
Intended Occupants
Here's a lesson you can really build on! Middle schoolers describe the occupants of an imaginary house during a character-building lesson. They create a cast of characters who share living space and provide details about their attitudes,...
Concord Consortium
Acid Test
This isn't your typical basic lesson—it's more acidic! Learners use pH information to determine the hydroxide ion concentration of different substances and then use these values to analyze information. The calculations require...
Concord Consortium
The Six Faces of Amzora
Here's a task that is out of this world! Given a description of a fictional cube-shaped planet, scholars answer a set of questions about the planet. They create a two-dimensional map and consider the distances between locations on the map.
Concord Consortium
Gestation and Longevity
Is the gestation length of an animal a predictor of the average life expectancy of that animal? Learners analyze similar data for more than 50 different animals. They choose a data display and draw conclusions from their graphs.
Concord Consortium
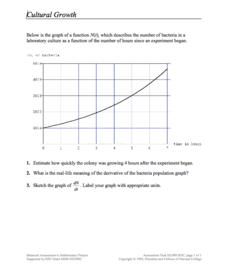
Cultural Growth
Scholars read and interpret a graph relating bacterial growth in a culture over time. They apply knowledge of derivatives, estimation, and graphing to the skill practice questions.
Concord Consortium
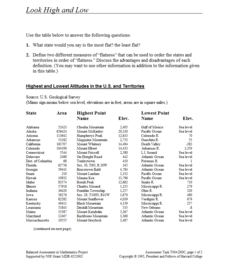
Look High and Low
From the highest high to the lowest low here's a resource that won't fall flat. Given data on the area and the highest and lowest elevations of each of the 50 states, learners decide which states are the least flat and the most flat. Of...
California Education Partners
Lashelles Garden
Let knowledge grow bountifully like plants in a garden. Given a diagram of a rectangular garden split into plots, scholars determine the area of the entire garden and the areas of the individual plots. As a culminating activity, they...
World Wildlife Fund
Graphs and Charts
A two-part worksheet incorporating bar graphs and pie charts, young mathematicians can practice their graphing skills. Pupils answer questions using graphs and charts but are also challenged to create their own using a given set of data.
Southwestern Medical Center
Field Epidemiology: Investigation of an Unknown Disease
More than 90 percent of the people in a building have come down with an illness, and it is your job to investigate. Teachers give scientists the data needed to decide what is important and how they can solve the mystery....
Chymist
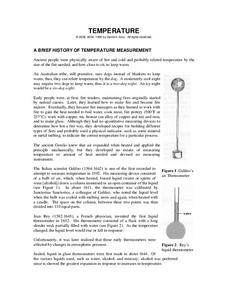
Temperature
Three Dog Night isn't just the name of a band; it is also the way an Australian tribe, who used dogs to stay warm, would describe the temperature on a cool evening. After reading about many different ways of measuring temperature, the...
Mathematics Assessment Project
Designing a 3d Product in 2d: a Sports Bag
Sew up pupil interest with an engaging, hands-on lesson. Learners first design a sports bag given constraints on the dimensions of fabric. They then evaluate provided sample responses to identify strengths and weaknesses of included...
Mathematics Assessment Project
Sampling and Estimating: Counting Trees
Your task today: count all the trees on a tree farm. To complete the assignment, learners first estimate the number of trees on a tree farm using random sampling. To improve their own response they then evaluate provided...
Other popular searches
- Math and Science Careers
- Integrated Math and Science
- Science and Math
- Science/ Math Games
- Math and Science Activities
- Integrating Math and Science
- +Math and Science Careers
- Math and Science Plan
- Math and Science Lessons
- Word Origins Science Math
- Math in Science Experiments
- Science Math


