Illustrative Mathematics
How Long
It won't take young mathematicians long to learn how to measure length with this fun, hands-on activity. Working in pairs, children use Unifix® or snap cubes to measure and record the lengths of different classroom objects. To extend the...
Curriculum Corner
Standard and Word Form Match
Challenge mathematicians to match 18 standard form number cards to their corresponding word form card and record their pairs on a graphic organizer.
Curated OER
Division with Remainders Grids
A great presentation about dividing with remainders! Learners use a graphic organizer (a grid), which helps them understand why some division problems have remainders, and some don't. An effective way to teach this often-confusing concept.
Curriculum Corner
Order of Operations Task Cards (1)
See how well learners know how to solve expressions using the order of operations. Use this packet that includes 28 task cards that requires pupils to evaluate expressions with variables, solve expressions using the correct order of...
CoreCommonStandards.com
Common Core State Standards: Second Grade Workbook
You've hit the second grade Common Core jackpot! Find over 40 pages of curriculum designed specifically for the standards, both math and language arts. Printable versions of each standard can be used as learning displays, and attractive...
Curriculum Corner
Area and Perimeter
Get third graders excited to work find area and perimeter of unit squares, rectangles, and irregular shapes. A 36-page packet comes with task cards, graphic organizers, practice worksheets, printables with squares, exit tickets, and word...
Curated OER
Mayan Math
Fifth graders investigate the Maya's as mathematicians. In this Mayan math lessons, 5th graders work with the ancient Mayan numbering system by comparing it to the American Number System. They tell the differences and similarities...
Virginia Department of Education
Integers: Addition and Subtraction
Young mathematicians construct their own understanding of integers with an inquiry-based math lesson plan. Using colored chips to represent positive and negative numbers, children model a series of addition and subtraction problems as...
Mathematics Vision Project
Module 4: Polynomial Functions
Bridge the gap between graphical and algebraic representations. Learners complete six lessons that begin by pointing out connections between the key features of a polynomial graph and its algebraic function. Later, pupils use the...
Willow Tree
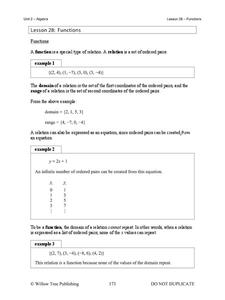
Functions
What makes a function a function? Learn the criteria for a relation defined as a function both numerically and graphically. Once young mathematicians define a function, they use function notation to evaluate it.
Mathematics Vision Project
Module 1: Functions and Their Inverses
Nothing better than the original! Help your class understand the relationship of an inverse function to its original function. Learners study the connection between the original function and its inverse through algebraic properties,...
Illustrative Mathematics
Shake and Spill
Entertaining as well as educational, this math activity about decomposing numbers is bound to capture the engagement of young learners. Given a cup and five two-color counters, young mathematicians simply shake and spill the cup,...
Rational Number Project
Initial Fraction Ideas: Lesson 3
Visual models support young mathematicians as they deepen their fractional number sense in this elementary math lesson. Using fraction circle manipulatives, children explore basic unit fractions as they develop the fundamental...
Charleston School District
Exploring Linear Functions
What does a graph or equation say about a situation? Lots! The lesson uses the concepts explored in the previous four lessons in the series and applies them to problem solving situations. Learners create an equation from problems posed...
Illustrative Mathematics
Weather Graph Data
Teaching young mathematicians about collecting and analyzing data allows for a variety of fun and engaging activities. Here, children observe the weather every day for a month, recording their observations in the form of a bar graph....
Beyond Benign
House Project Overview
What does your perfect house look like? Pupils design a sustainable house given certain specifications. They create concept maps that detail the math skills they need to use while considering their designs.
Chapman University
A Pythagorean-Style Proof of the Sine Sum-of-Angles Formula
This well organized poster shows a step-by-step algebraic proof and related graphic. Understanding how formulas were derived, connects learners to the idea that the study of mathematics is continuous and cumulative. Learners will also...
EngageNY
Choosing a Model
There's a function for that! Scholars examine real-world situations to determine which type of function would best model the data in the 23rd installment of a 35-part module. It involves considering the nature of the data in addition to...
EngageNY
Modeling with Quadratic Functions (part 1)
Relevance is key! The resource applies quadratic modeling by incorporating application of physics and business. Pupils work through scenarios of projectile motion and revenue/profit relationships. By using the key features of the graph,...
Chapman University
Graphs of the Sine and Cosine Function in Degrees
This bright, clear, graphic, display of the sin(x) and cos(x) functions spans the domain between -360 degrees and 360 degree. Use it as a poster, handout, presentation slide, or project it onto a whiteboard.
Chapman University
Graphs of the Sine and Cosine Function in Radians
This bright, clear, graphical display of the sin(x) and cos(x) functions spans the domain between -2 pi radians and 2 pi radians. Use it as a poster, handout, presentation slide, or project it onto a whiteboard.
Illustrative Mathematics
Roll & Build
Develop young mathematicians' understanding of place value with this hands-on math activity. Working in pairs, learners take turns building two-digit numbers by rolling two ten-sided dice. Base ten blocks are then used to model the...
Curated OER
Sort It Out
Elementary schoolers engage in a game of logical reasoning called Secret Sort. A Venn diagram is used as a way to sort objects. This resource would be a great way to introduce the Venn diagram (maybe the most famous, and most-useful...
Curated OER
Sharing or Grouping?
In division, word problems often help learners understand the application aspect of the math. By prompting them to label division problems as either grouping or sharing, this worksheet takes a less intimidating and more relatable...


