Curriculum Corner
I See a School
Enthusiastic readers report on a book detailing what it's about and their favorite part with a picture-based writing template. A nonfiction version takes a step further to highlight what the pupil learned, and a fiction version showcases...
Curated OER
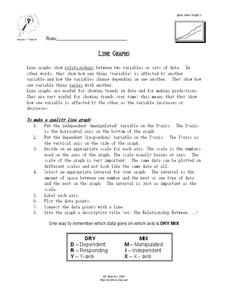
Line Graphs
In this algebra worksheet, young scholars describe the relationship between a line graph and its data. They define the reasons line graphs are used and discuss increasing and decreasing lines. There is one involved questions, requiring...
Curated OER
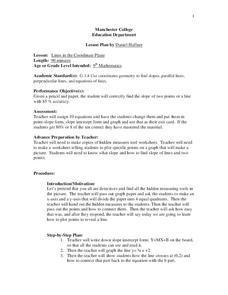
Lines in the Coordinate Plane
Students graph lines in a coordinate plane. In this geometry lesson, students graph lines on a coordinate plane, and identify the slope. They classify the lines as parallel or perpendicular and write an equation of a given line.
Curated OER
Plot It
Young scholars use a stem-and-leaf plot from a set of data to identify the range, median, and mode of their own math grades.
Curated OER
Box-and-Whisker Plots
Eighth graders measure in feet and inches and convert to explore the relationship between the converted measurements. In this measurement lesson, 8th graders use the whisker and box plot to represent the measurement of a cat. ...
Curated OER
Depth Line
Students use adding machine tape to plot increasing ocean depths and deep sea historical events.
Curated OER
Unit 13: Graphs, Correlation, Line of Best Fit
Students explore the concepts of graphs, correlations, line of best fit, and the dipstick problem. In this graph, correlation, line of best fit and dipstick problem lesson, students solve problems on the above mentioned topics. ...
Curated OER
Line Of Best Fit: Feet & Forearms
Students actively find the line of best fit. They gather their own data and then use a calculator to find the line of best fit, as well as the equation. They see how to use the TI 81 calculator in order to find the line of best fit.
Inside Mathematics
Graphs (2006)
When told to describe a line, do your pupils list its color, length, and which side is high or low? Use a worksheet that engages scholars to properly label line graphs. It then requests two applied reasoning answers.
PBS
Working with Coordinate Planes: Activities and Supplemental Materials
Seven activities make up a collection of supplemental materials to reinforce graphing on a coordinate plane. Worksheet objectives include plotting coordinates within single and four quadrants, measuring straight and...
Curated OER
Barbie Bungee
Middle and high schoolers collect and analyze their data. In this statistics lesson, pupils analyze graphs for linear regression as they discuss the relationship of the function to the number of rubber bands and the distance of the...
Scholastic
Midnight Magic Discussion Guide
This discussion guide accompanies the fiction book Midnight Magic written by Avi, enforces story elements, inferences, and theme/plot. Have the class work on it over time, it will engage even your reluctant readers.
Houghton Mifflin Harcourt
Unit 8 Math Vocabulary Cards (Grade 4)
Enhance fourth graders' math vocabulary with 17 word cards and their definitions. Learners focus on terms that deal with graphing, such as y-axis, coordinates, plot, and ordered pair in the last set of math vocabulary cards.
Orlando Shakes
Julius Caesar: Study Guide
What makes a good leader? Use the curriculum guide for William Shakespeare's Julius Caesar to help scholars answer that question. Pupils research the play's historical context and other background information before engaging in...
K20 LEARN
You’re The Network: Data Analysis
How do you rate? Young scholars use graphical data to analyze ratings of different television episodes. Their analyses include best-fit lines, mean, median, mode, and range.
College Board
2004 AP® Statistics Free-Response Questions Form B
Over the years, data analysis has been important. Looking back to the 2004 AP® Statistics Form B free-response questions, pupils and teachers see the importance of analysis of data sets. The six questions contain analysis of data on...
Radford University
Got Slope?
Go around and around with slope. The class investigates tornadoes by watching videos, building a homemade tornado, and performing research on the Storm Prediction Center website. Groups gather data and create scatter plots for twisters...
Radford University
How to Calculate and Analyze the Equation for a Parabolic Path
Working in groups, pupils plot three points on the coordinate plane representing three different parabolic paths. Using a calculator, they determine the quadratic regression equation for their models. Each team then figures out the...
Learning to Give
Teaching Playwriting in Schools
The world is a stage, and so is your classroom! Hone the skills of the next generation of Tony® award winners with a set of exercises, reference pages, writing prompts, and excerpts from famous plays.
Curated OER
Super Bowl Champs
For this Super Bowl worksheet, students create line plots of all winners and losers of the Super Bowl. They create stem-and-leaf plots, scatter plots, and bar graphs of football data. This one-page worksheet...
Curated OER
The Dog Days of Data
Students are introduced to the organization of data This activity is designed using stem and leaf plots. After gather data, they create a visual representation of their data through the use of a stem and leaf plot. Students
drawing...
Albert Shanker Institute
Economic Causes of the March on Washington
Money can't buy happiness, but it can put food on the table and pay the bills. The first of a five-lesson unit teaches pupils about the unemployment rate in 1963 and its relationship with the March on Washington. They learn how to create...
Curated OER
Highs and Lows
Plot data using the number line and discuss how negative numbers are used in math and science. Sixth and seventh graders share their graph with the class and provide an explanation for their plotting.
CCSS Math Activities
Scatter Diagram
Don't let a great resource scatter to the winds. Pupils analyze two sets of test scores on a scatter plot. They draw a line of best fit and use it to make predictions about the test scores. They also consider any apparent trends in the...


